Index
EIS Diagnosis for PEM Fuel Cell Internal Condition
– The effect of humidification temperature on air utilization properties of PEMFC –
Abstract
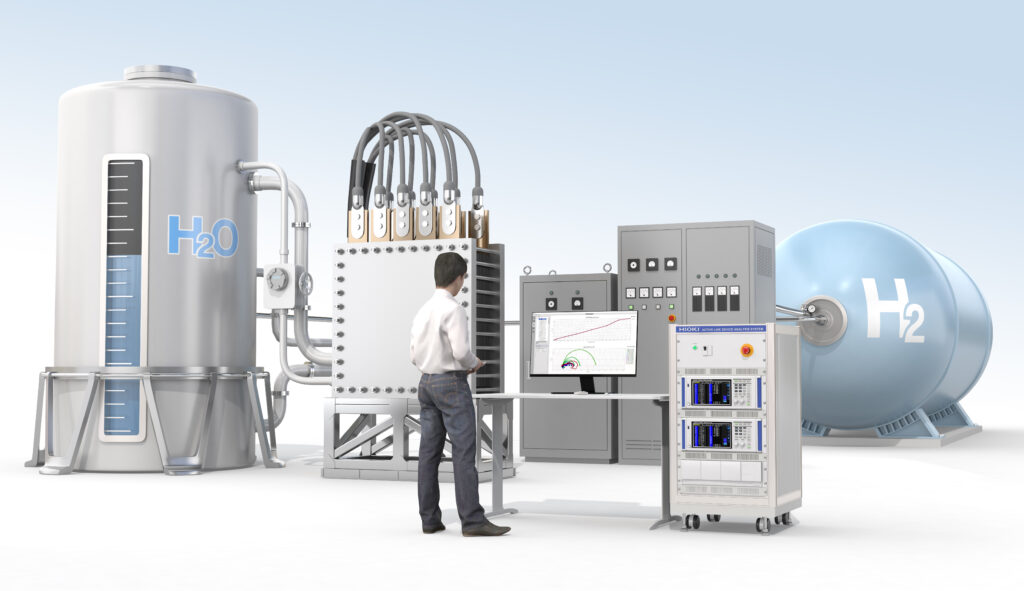
Fuel cells, which generate electricity using hydrogen (H₂) and oxygen (O₂), are expected to become the next generation of clean energy. Fuel cells are attracting attention toward a decarbonized society, and development and research are being actively conducted.
Polymer Electrolyte Membrane Fuel Cells (PEMFCs) use a polymer membrane to exchange protons to produce water, which is then used to generate energy. They are used in fuel cell vehicles (FCVs) and household cogeneration systems because they operate at lower temperatures (about 80°C) than other fuel cells. By stacking PEMFC, it can produce large power. For efficient operation, it is important to analyze internal conditions during operation.
We introduce our new solution “ALDAS”, which is an impedance measuring system for large scale fuel cells under operating condition. By using ALDAS, you can analyze factor-specific resistance values for the complex internal structure of fuel cells, thus identifying the cause of reduced power output.
Issue

As fuel cells become more widely used, there is a need to further improve their operating efficiency and extend their service life. However, the internal structure of fuel cells is complex, and their performance is affected by various factors, such as the humidifying temperature of the supply air.
I-V curve measurement has been used as an evaluation method for fuel cells. However, it is difficult to determine from the I-V curve whether the cause of the decline in performance is due to degradation of the internal components of the fuel cell or whether the output is reduced due to operating conditions.
Therefore, it is necessary to establish a method to diagnose the internal conditions and the decline in output that cannot be identified only by the decline in voltage, in order to improve the efficiency and extend the service life of fuel cells.
Solution
The electrochemical impedance spectroscopy method (EIS) determines impedance by applying an AC signal to electrodes, measuring and comparing the response currents. Spectral analysis can also be performed by varying the modulation frequency of the AC signal.
EIS measurements provide information corresponding to changes in operating conditions as well as electrode reaction processes and electrode structures from each impedance component.
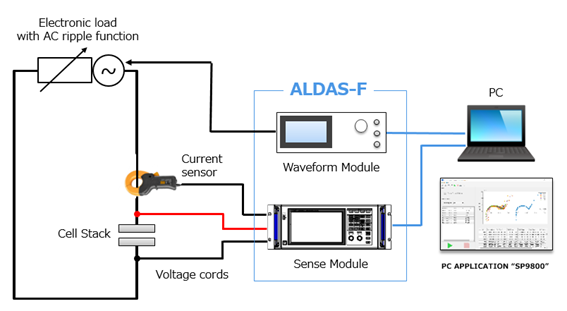
ALDAS is an impedance analyzer for small laboratory-level fuel cells to large fuel cell stacks. ALDAS can provide a new evaluation method by performing accurate EIS measurements regardless of the scale of fuel cell.
Experimental Conditions
EIS measurements were made during fuel cell operation at constant load current value, cell temperature, and hydrogen flow rate. The relationship between changes in internal conditions and impedance measurements was investigated using fuel humidification temperature and air flow rate as parameters
- DC current 10A
- Electrode area 25 cm².
- Cell temperature 80℃
- Hydrogen flow rate 180mL/min
- humidifier temperatures measured at 55℃, 65℃, 75℃, 80℃.
- Using the flow rate at 100% air utilization as a reference, the air flow rate was increased stepwise starting from 450 mL/min to 2250 mL/min as 20% air utilization.
Result
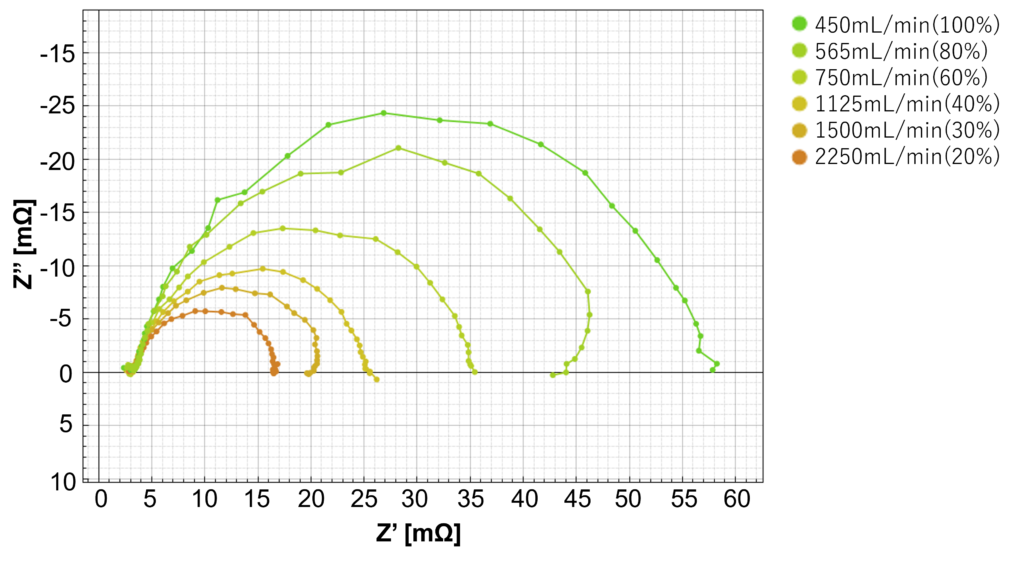
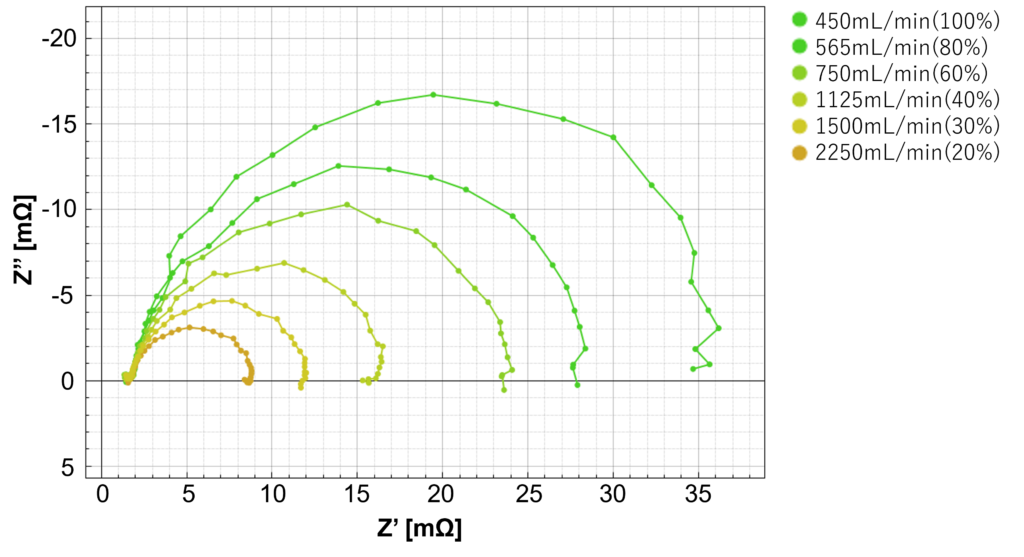
EIS measurements were performed at different air flow rates ranging from 450 [mL/min] at 100% air utilization to 2250 [mL/min] at 20% air utilization, and the diameter of the arc drawn in the Nyquist plot tended to decrease with increasing air flow rate, regardless of humidification temperature. This indicates that the mass transfer resistance decreased as the air flow rate increased (Figure 3 – 6).
However, there is a difference in the rate of decrease. The higher the humidification temperature, the greater the resistance at high air utilization, and the greater the rate of decrease. The Nyquist plot suggests that under high humidification temperatures and low air flow rates, excessive moisture accumulates and impedes diffusion.


Cell voltage and air utilization
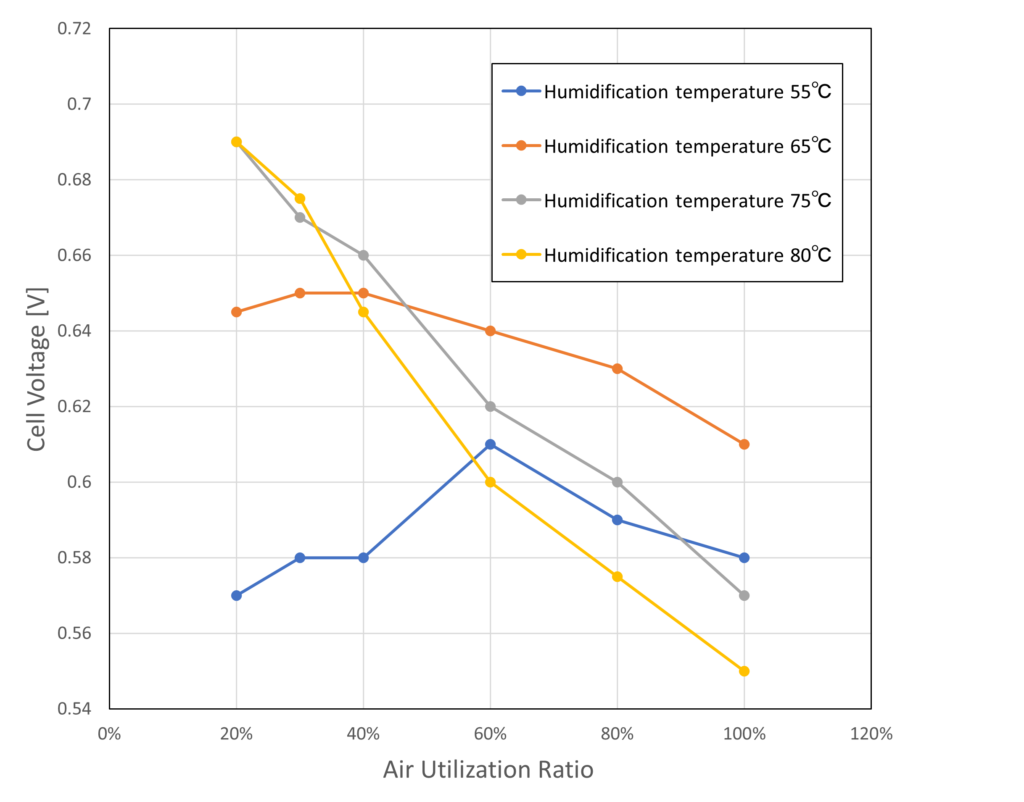
The above results are first examined in terms of cell voltage.
As Figure 7 shows, when the humidification temperature is low, the cell voltage does not change much even if the air utilization rate is reduced, but when the humidification temperature is high, the cell voltage increases significantly when the air utilization rate is reduced. This may be due to the following two facts.
– The low humidification temperature does not allow sufficient moisture to be transmitted to the membrane.
– When humidifying temperatures are high, more air flow is needed for proper moisture discharge.
However, since the internal conditions of fuel cells vary depending on the degradation of components and moisture management conditions, cell voltage alone cannot identify the cause of these changes.
Comparison of EIS measurements at different humidification temperatures
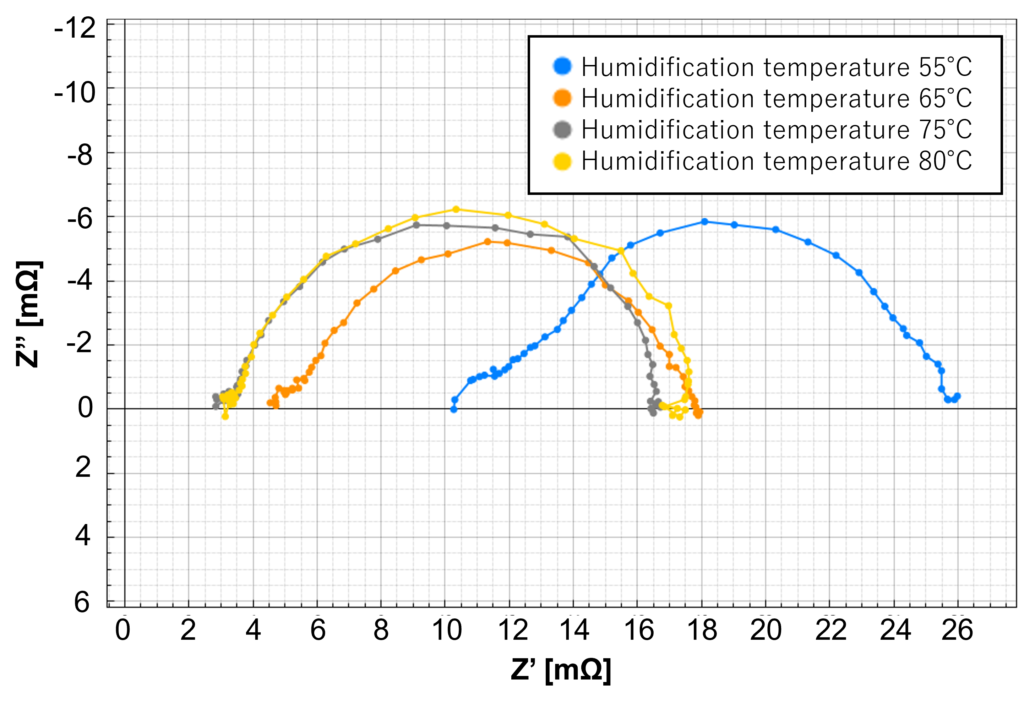
Comparing the Nyquist plot for each humidification temperature at 20% air utilization, we can see that the left end of the arc (high-frequency side impedance) increases at a humidification temperature of 55℃, resulting in a higher membrane resistance value. This is thought to indicate that the membrane is drying out due to inadequate humidification. When the humidification temperature exceeds 65℃, the relative humidity is approximately 55% or higher, and the membrane is moistened, resulting in a lower resistance value. The EIS measurement can diagnose the membrane condition from the membrane resistance value.
Conclusion
Although the I-V curve can confirm a decrease in fuel cell output, it is difficult to determine the cause of the decrease. Lowering the humidification temperature will dry out the membrane, and increasing the air utilization rate will inhibit diffusion. However, the structure of a fuel cell is complex, and deterioration of components or changes in internal conditions due to other operating conditions may be the cause of reduced output.
In EIS measurements, changes in internal conditions for each condition can be viewed from a Cole-Coile plot. By collecting and comparing EIS measurement data for each operating condition, it is possible to diagnose internal conditions based on resistance values, and thus to determine if components are deteriorating or membranes are drying out.
The “ALDAS” impedance analyzer for large scale fuel cells makes it possible to analyze the internal resistance of large-scale fuel cells using the electrochemical impedance method (EIS), which was not possible before.