Index
EIS Diagnosis for PEM Water Electrolyzer
– The influence of catalyst loading on EC performance –
Abstract
Hydrogen (H2) is attracting significant interest as a prospective clean energy resource for the future. The anticipated growth in hydrogen energy is projected to result in a corresponding increase in hydrogen production. However, the conventional methods of producing hydrogen primarily rely on fossil fuels, including coal, natural gas, and petroleum, where carbon dioxide is produced as a byproduct.
The polymer electrolyte membrane electrolysis cell (PEMEC) uses a proton exchange membrane technique to perform water electrolysis. Due to its high energy efficiency and large hydrogen production yield, it is being used in combination with renewable energy resources to build carbon-free, large-scale hydrogen production power plants. As the size of PEMECs grows in direct proportion to the demand for hydrogen production, a large electric current is required to power the equipment. As a result, the internal diagnosis of high-current PEMECs through conventional measurement methods becomes increasingly complicated.
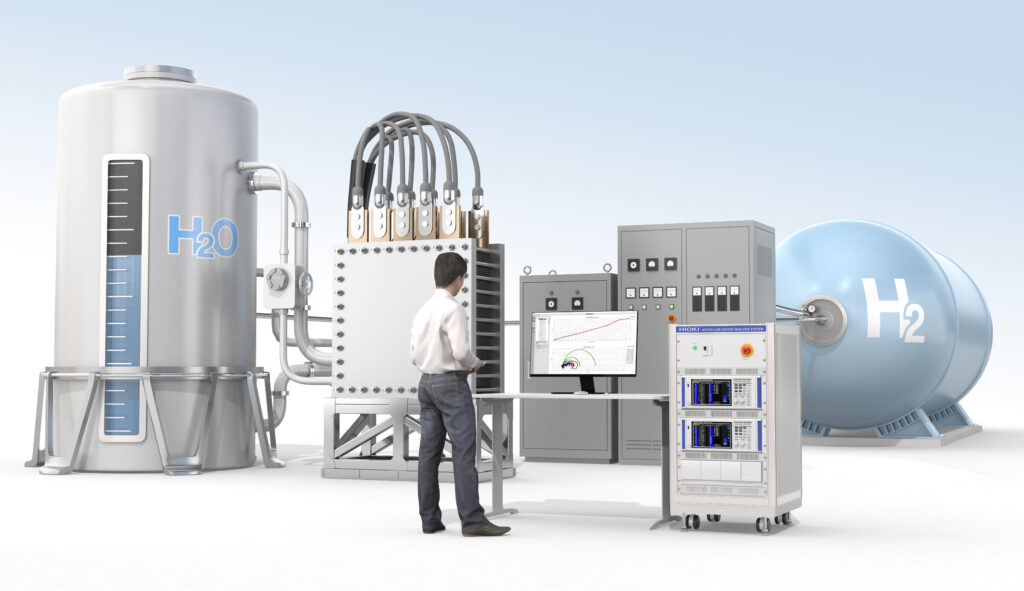
For that reason, the ALDAS impedance analyzer is the solution in order to facilitate large-scale water electrolysis cells’ internal resistance analysis through the utilization of the electrochemical impedance spectroscopy (EIS) technique, a capability that was previously impossible. This application note describes how an EIS can help in efficient monitoring and assessment of cell operations.
Issue
In order to improve the performance and prolong the lifespan of water electrolysis cells (EC), it is important to understand the performance degradation factors that occur within the cells.
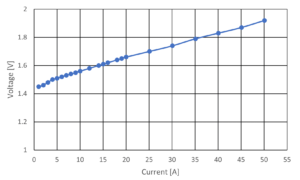
The I-V curve, as shown in Figure 1, is commonly used as a method to evaluate the performance of electrolysis cell. Unfortunately, the I-V curve does not provide enough information to identify which internal component of the water electrolysis cell is causing the resistance.
Therefore, it is necessary to establish a measurement method to isolate and analyze the internal resistance component of the electrolysis cell.
Solution
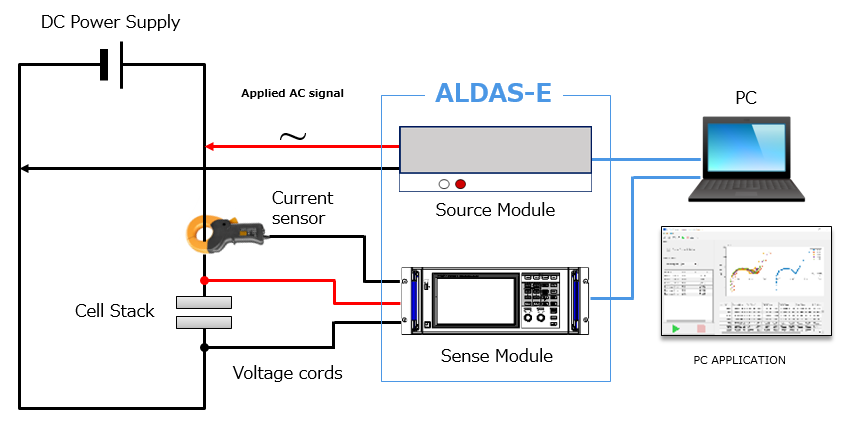
The EIS method for calculating impedance involves measuring and comparing the response voltage to the AC current signal applied to the cell electrode.
EIS measurements offer significant insights into the structure of the electrode and its reaction process, including the catalyst’s performance and the degree of electrical contact smoothness between the electrode and each component. Hence, the EIS measurement method can be used to separate and analyze different resistance component reactions in the water electrolysis cell.
ALDAS is an impedance analyzer that has a wide range of applications, from small laboratory-level electrolysis cells to large-scale electrolysis cells in electrolysis plants. It creates a new assessment technique by achieving precise EIS measurements, irrespective of the size of the electrolysis cell.
Experimental Conditions
Below are the sample experiment conditions. Two different types of anode catalyst loadings are used to test the performance of catalyst-coated membranes (CCM) in an electrolysis cell using ALDAS.
- Catalyst load
– [Type-A] Anode : IrO2-TiO2 1.06mg/cm2
Cathode : Pt/C Pt-50%
– [Type-B] Anode : IrO2-TiO2 2.05mg/cm2
Cathode : Pt/C Pt-50%
- Water flow rate 50ml/min
- Cell temperature 60℃
- Electrode area 25cm2
Result

The equivalent circuit shown in Figure 3 is used as a reference for electrode structure analysis, where:
Rsol is the membrane resistance due to the proton conductivity of the electrolyte membrane.
Rct is the charge transfer resistance of the catalyst layer.
Cdl is the electric double layer capacitance.
Rmt and Cmt stand for resistance and electric capacitance due to the mass transfer (material diffusion) process, respectively.
I-V Comparison
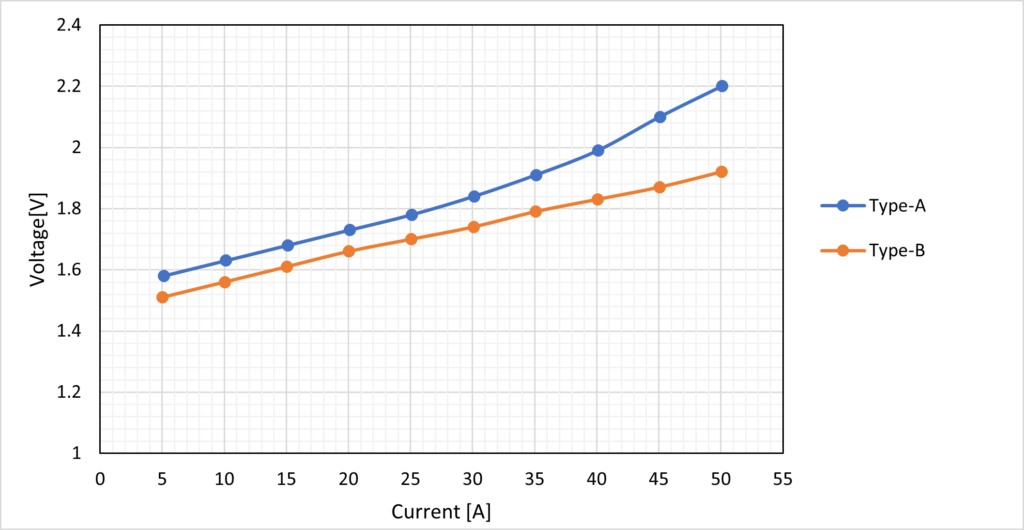
Figure 4 shows the I-V curve for low catalyst load Type-A and high catalyst load Type-B results. The results show that high catalyst load Type-B performs better than low catalyst load Type-A, and it also has lower overvoltage losses given that it has a higher catalyst load. The low catalyst load Type-A exhibits a substantial rise in voltage measurement at high input current ranges beyond 35 A, indicating a rise in the magnitude of its resistance from this I-V curve. However, it is not enough to identify a type of resistance component from this I-V curve.
EIS measurements comparison
EIS measurements were used to examine the resistance component, which cannot be identified from the I-V curve. Figures 5, 6, and 7 show the Nyquist plots, also known as the Cole-Cole plot, derived from EIS measurements made simultaneously with the previous I-V measurements at 10 A, 25 A, and 40 A, respectively.
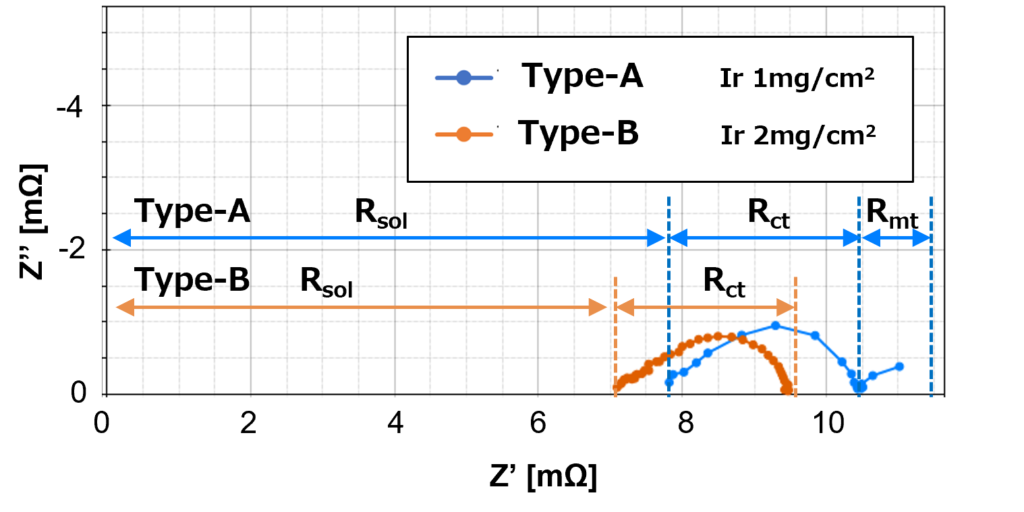
Figure 5 shows that high catalyst load Type-B produces one arc, which only consists of charge transfer resistance, Rct. On the other hand, the low catalyst load Type-A produces two arcs, which consist of one on the high-frequency side with charge transfer resistance, Rct and one on the low-frequency side with diffusion resistance, Rmt.
Despite the same amount of current density applied to both Type-A and Type-B, it shows that high catalyst load Type-B has smaller proton conductivity membrane resistance in comparison to low catalyst load Type-A, and hence the Type-B curve shifts to the left of the Type-A curve.
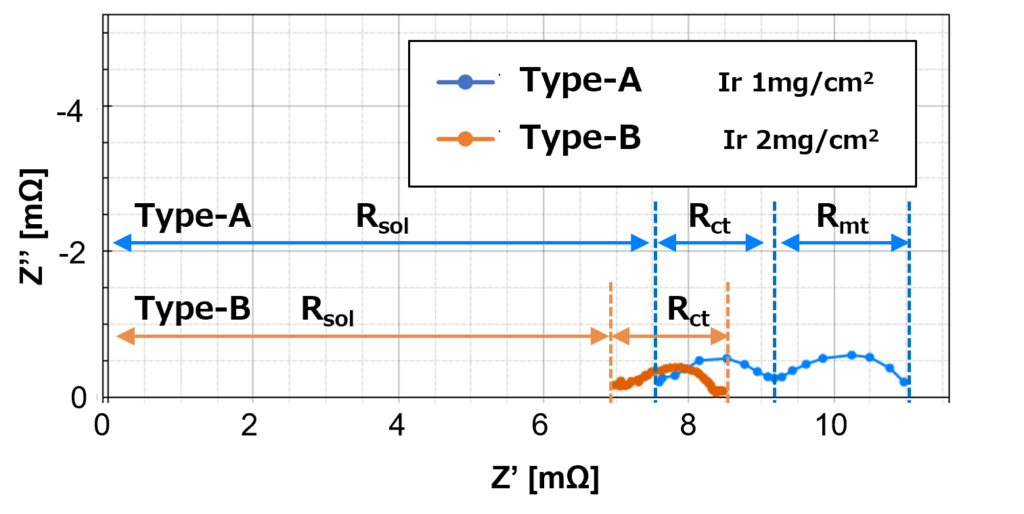
Nyquist plot in Figure 6 shows the diffusion resistance, Rmt for low catalyst load Type-A at 25 A significantly increase compares to the results at 10 A in Figure 5. The diffusion resistance for low catalyst load Type-A increases when the supply current increases for a number of reasons, including a decrease in the number of active sites on the catalyst surface, and an increase in the thickness of the product layer as a result of the product that forms on the catalyst surface.
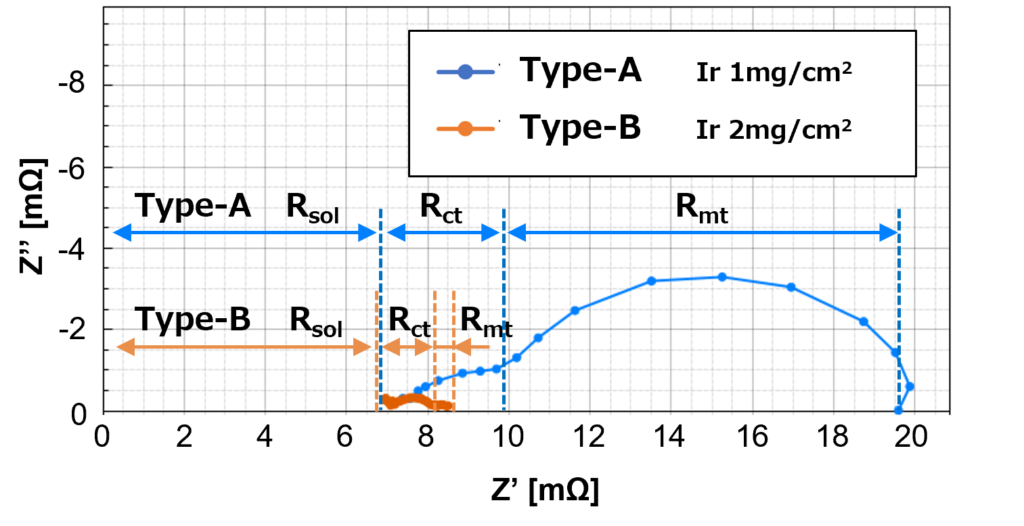
Figure 7 shows the EIS measurement results at 40 A.
High catalyst load Type-B, which did not exhibit a diffusion resistance arc for 10 A and 25 A previously, starts to appear at 40 A.
Nevertheless, the magnitude of the diffusion resistance for high catalyst load Type-B is smaller in comparison to low catalyst load Type-A, which shows that the diffusion resistance is large and significant. Hence, it increases the magnitude of the overall resistance for low catalyst load Type-A, which is also reflected in the I-V curves in Figure 4. The high current density means that there is a high demand for reactants at the catalyst surface. When the demand cannot be met by the diffusion of reactants to the catalyst surface, the diffusion resistance becomes significant at high current density.
Conclusions
The outcome of this sample experiment demonstrates that the thickness of the catalyst load layer has an impact on the mass transport mechanism within the catalyst layer, which in turn has a significant effect on diffusion resistance, Rmt.
High catalyst load Type-B with a thicker catalyst layer has lower membrane resistance due to the higher water content in the electrolyte membrane, and hence, the diffusion resistance is insignificant in comparison to low catalyst load Type-A. This indicates that the thicker anode catalyst layer provides adequate water supply to the interface between the electrolyte membrane and the catalyst layer.
The catalyst layer experiences degradation over extended periods of operation in the electrolyzer. By using the EIS measurement method, the quality of the catalyst layer can be evaluated through internal resistance analysis.
The EIS measurement can provide performance degradation factor analysis for specific material selections that are not attainable by the I-V curve, which contributes to efficient research and development.
In conclusion, the ALDAS impedance analyzer provides a groundbreaking solution for analyzing the internal resistance of large-scale water electrolysis cells through electrochemical impedance spectroscopy (EIS), a capability that was previously unattainable.