Index
PW8001 Version 2: New Features
Hioki, which has revolutionized high-frequency power measurement with its automatic phase shift function for current sensors, now brings a paradigm shift to the world of power analysis with Power Spectrum Analysis and whole array of new/improved features.
Version 2, the latest firmware of the Power Analyzer PW8001 presents many innovative functions. Best of all, it’s only a free update away.

Table of contents
PW8001 overview
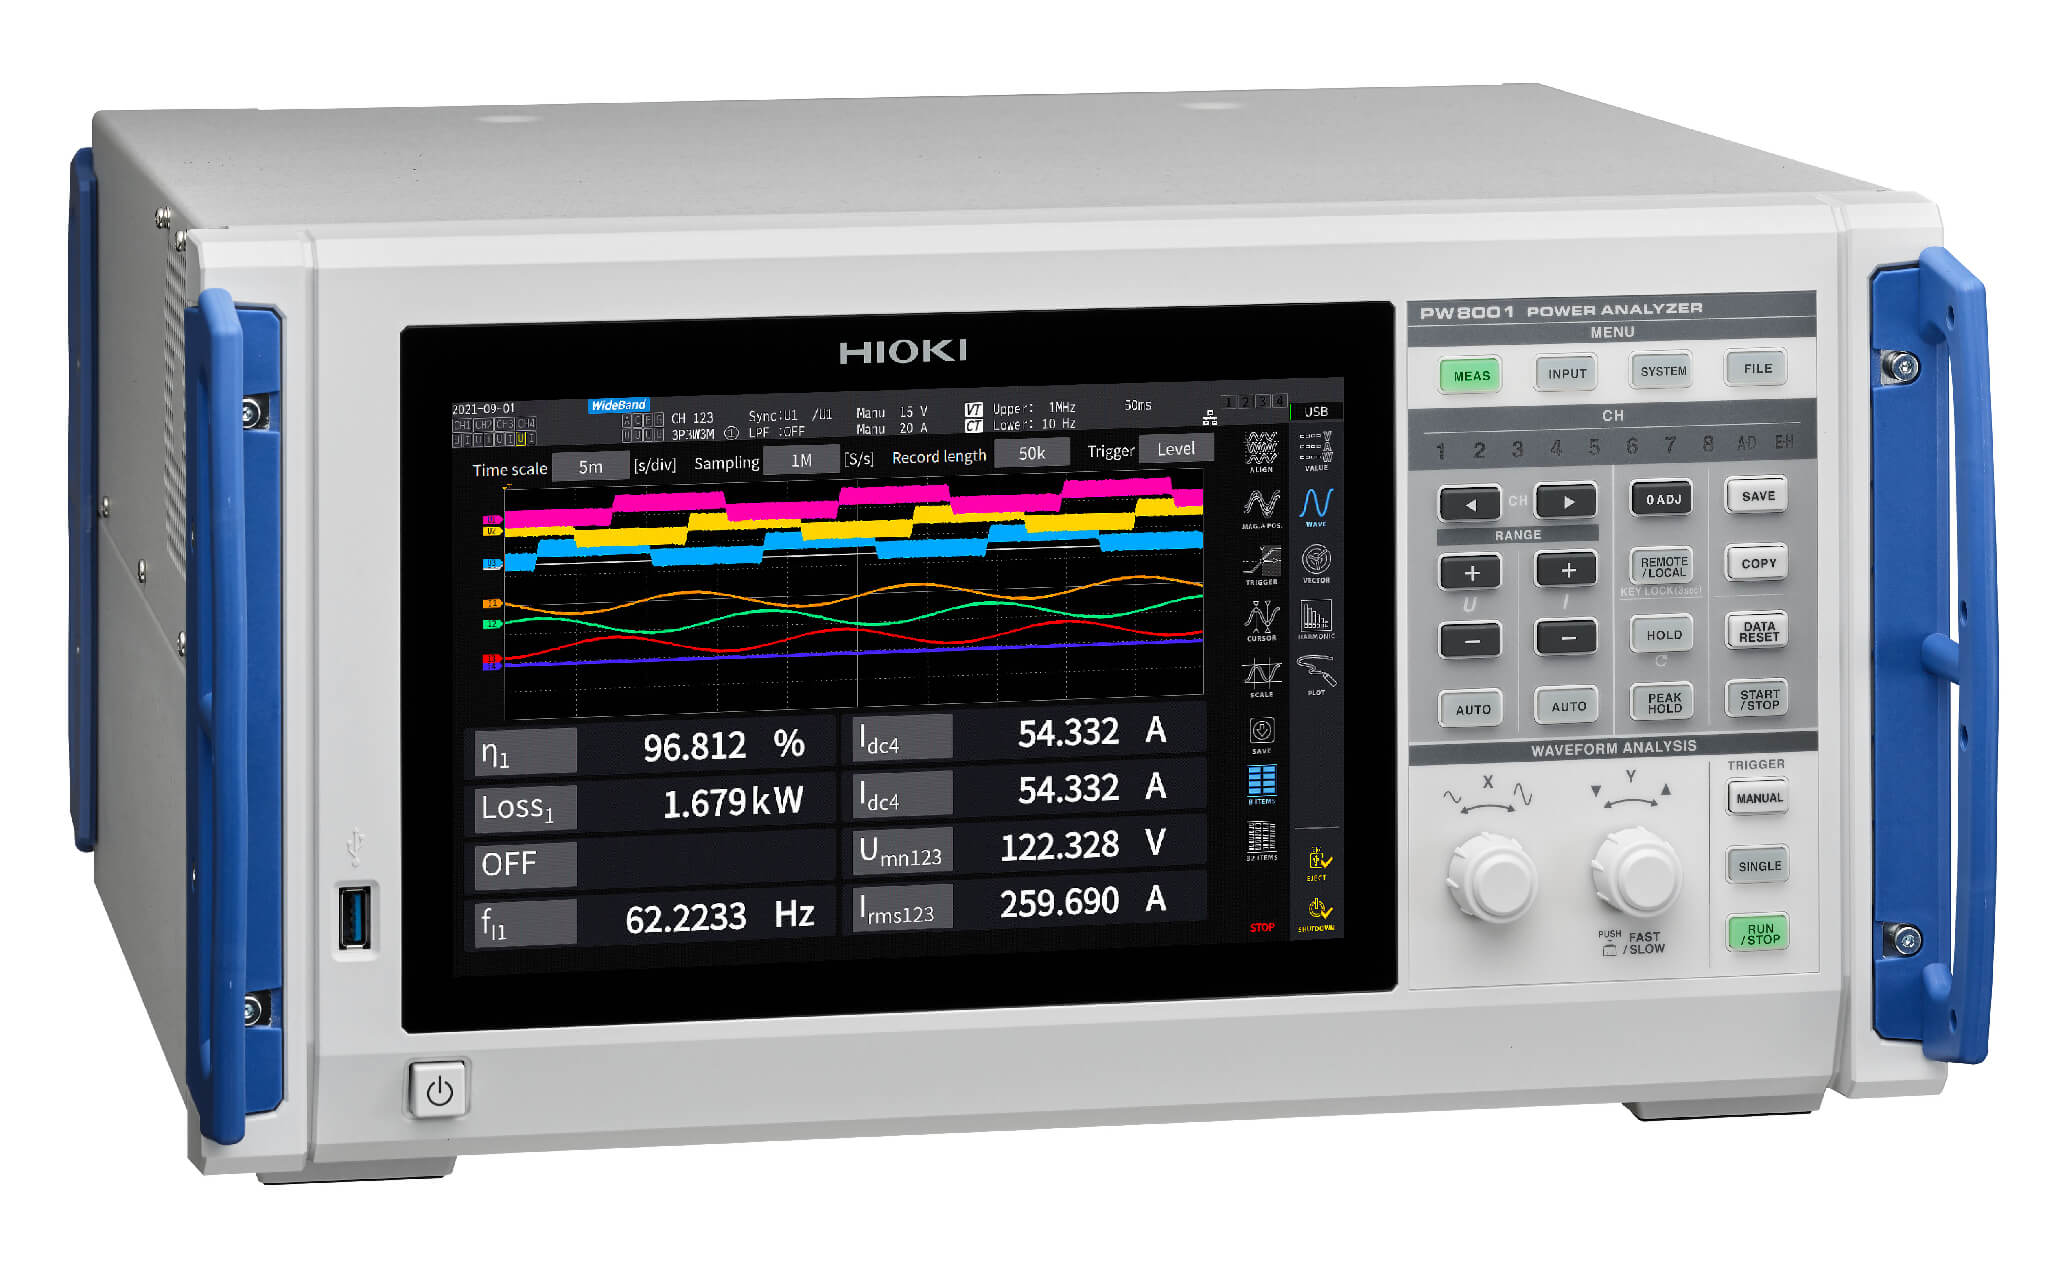
The PW8001 can accurately measure power conversion efficiency in devices like state-of-the-art inverters and motors. Featuring world-class measurement accuracy, the instrument is Hioki’s flagship power analyzer.
• Enjoy world-class measurement accuracy.
• Accurately capture power fluctuations caused by high-speed switching.
• Build optimal measurement systems.
Hioki, the world’s only instrument manufacturer that develops both power analyzers and high-precision current sensors in-house, is uniquely qualified to provide comprehensive solutions for power analysis.
Power Spectrum Analysis (PSA)
Video: Introducing the PSA Function for Best Investigating Loss Factors in Power Conversion
Issue background
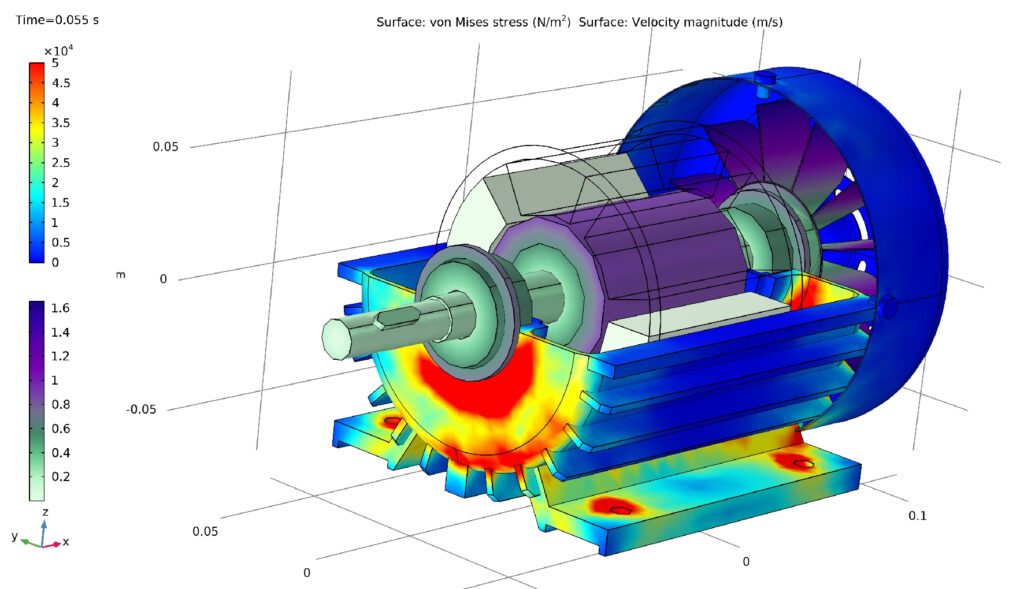
As use of SiC and GaN power semiconductors leads to higher switching frequencies, reducing power loss in the high-frequency domain is becoming an issue in development. By allowing high-frequency power to be intuitively and quantitatively assessed in ways that would be impossible with conventional harmonic analysis, the PW8001 can play a useful role in optimization of inverter control design and in motor magnetic design.
Overview of functions
○ Accurately assess active power frequency distribution across a wide band
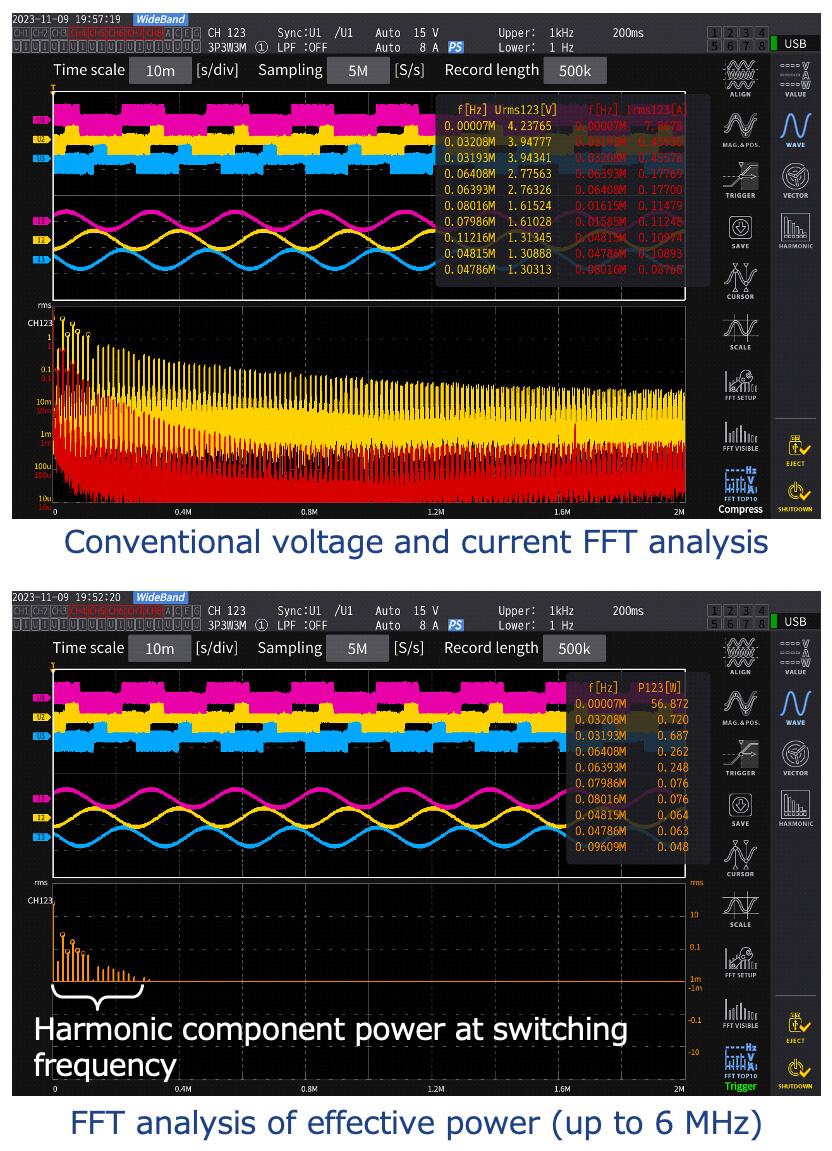
• Power Spectrum Analysis (PSA) applies FFT analysis to recorded waveforms of voltage, current, and active power, in real-time and up to a maximum of 6 MHz.
• The instrument automatically compiles a “Top 10” list of peak components and displays a list of associated values.
• By combining a Hioki current sensor of excellent frequency characteristics with the PW8001’s automatic phase correction technology, you can perform reliable verification work of up to high frequencies.
So what’s the big deal?
AC Power: Typical FFT analyzes current and/or voltage but can’t do AC power because of high-frequency phase error. Hioki can do FFT of power because the high frequencies can be accurately captured.
○ Investigating loss factors in power conversion
• PSA yields important clues and trends about sources of loss in power conversion.
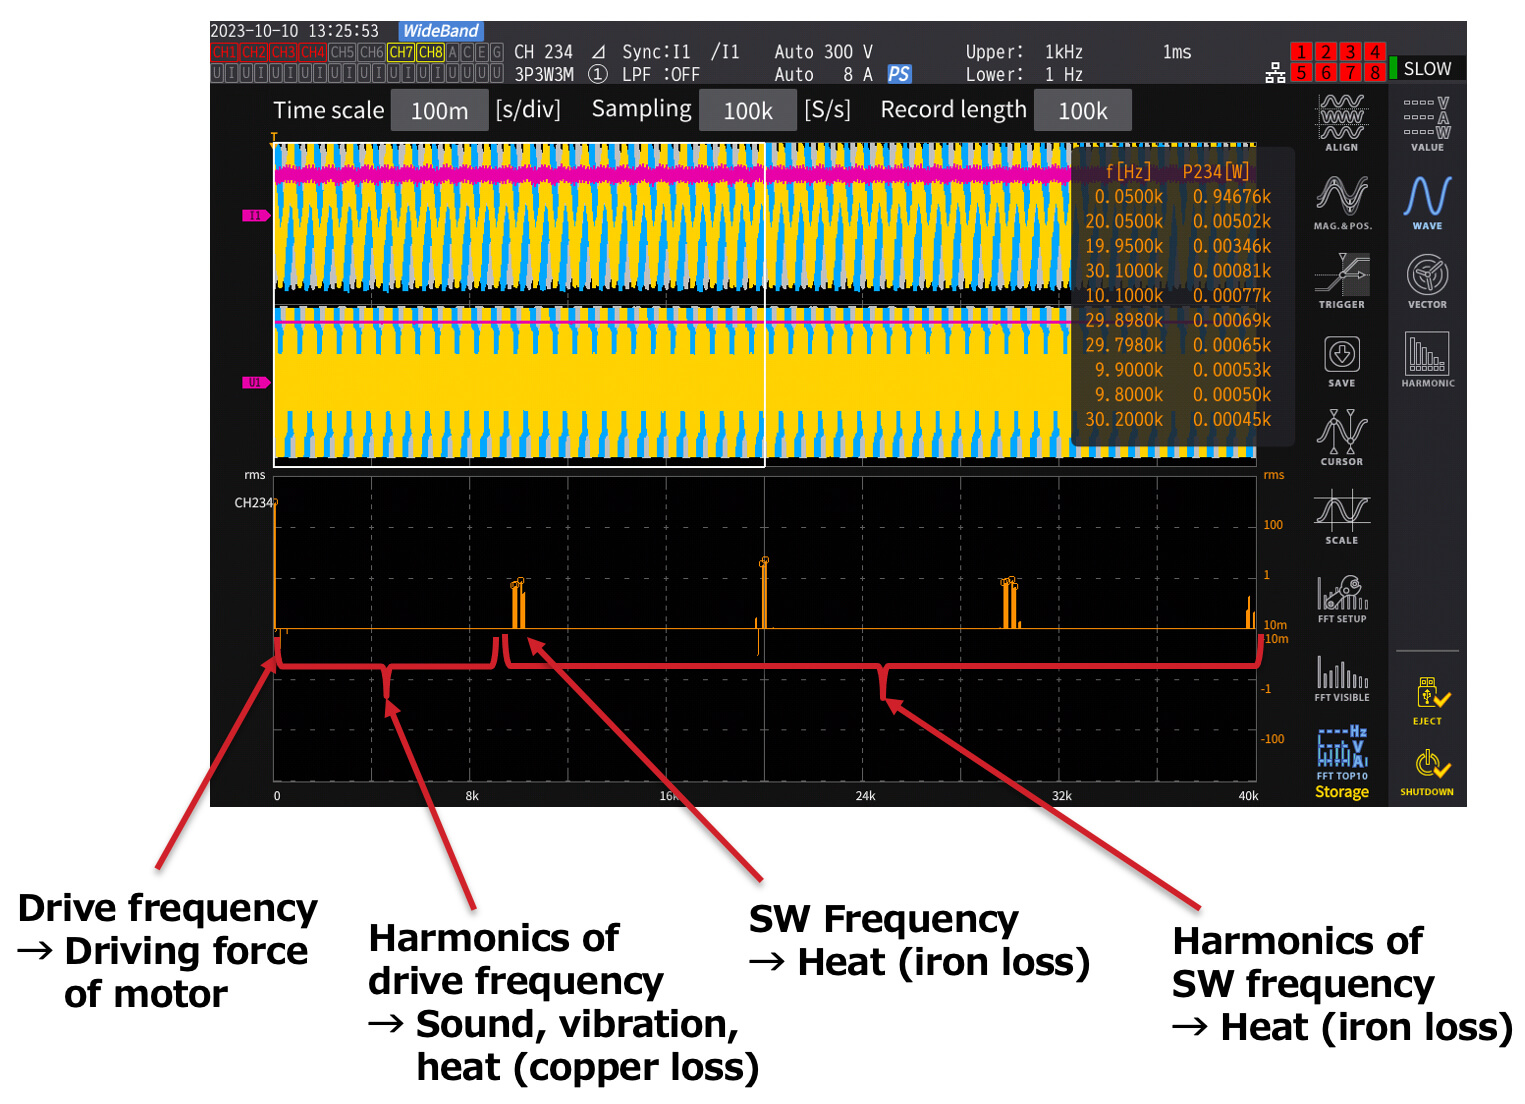
• When you use PSA on the secondary (AC) side of an inverter, you’re able to assess active power by separating the frequency components of the drive frequency from that of the switching frequency.
• When active power is supplied by an inverter to a motor, active power apart from the drive frequency is lost in the form of heat, noise, or vibration.
• You can evaluate your efforts to reduce heat, noise, and vibration by finding correlations between the your countermeasure and the PSA analysis.
Use cases
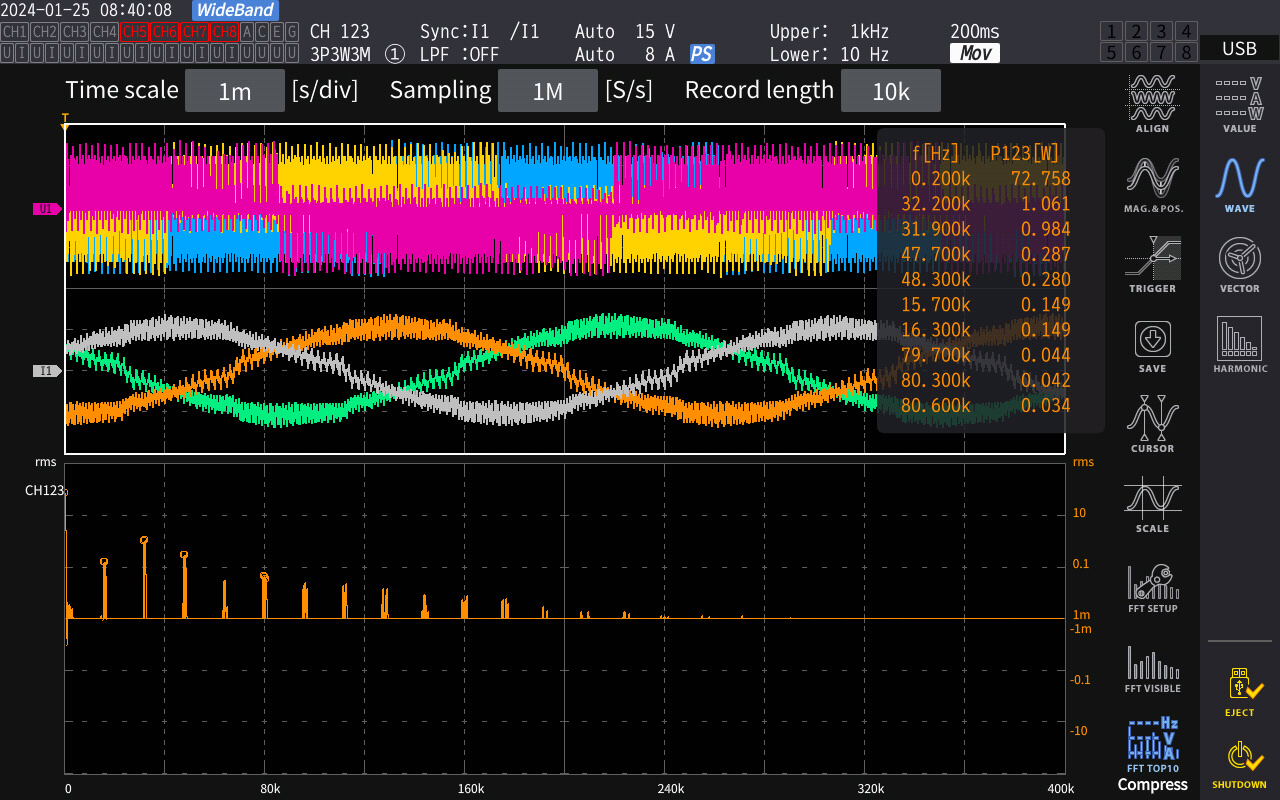
Loss evaluation and analysis using the Power Spectrum Analysis (PSA) function
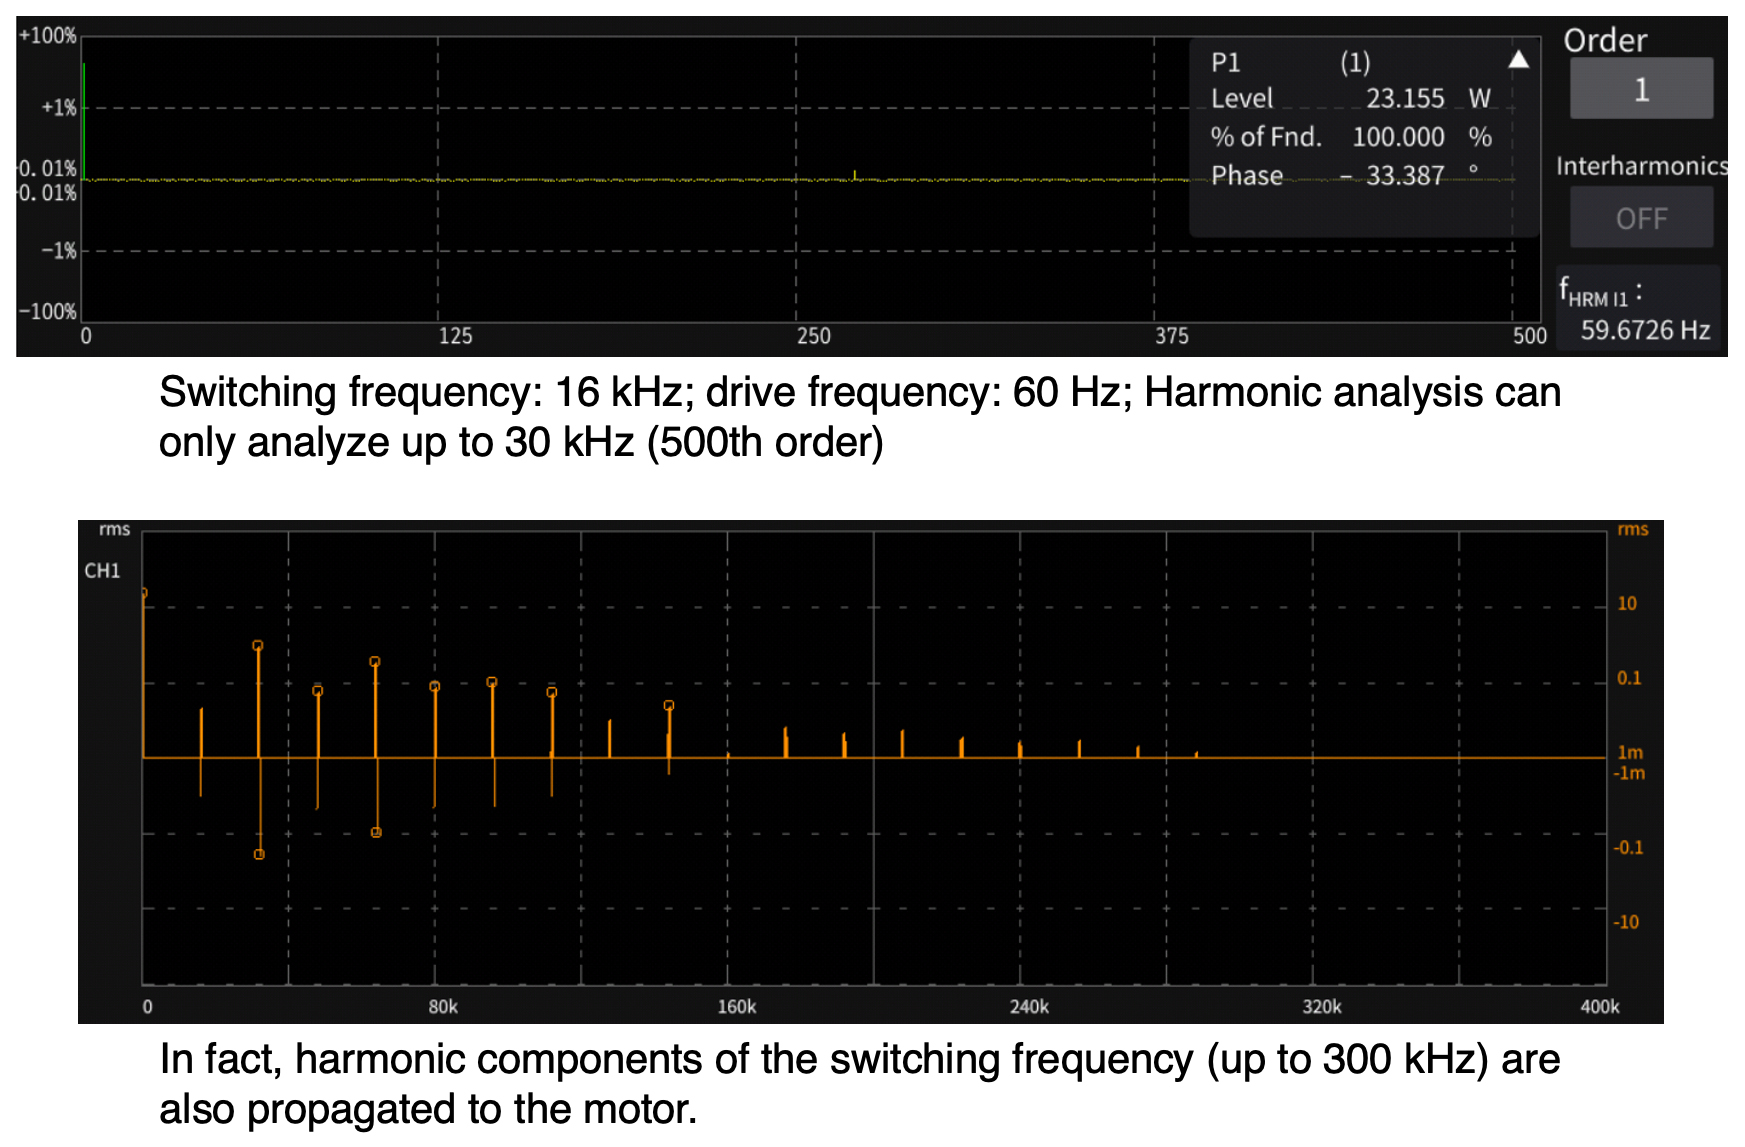
Harmonic analysis is not a sufficient tool for reviewing the power-harmonic distribution of both the motor and inverter—the PSA solves this issue. Since the ever-changing frequency of the motor creates ever-changing harmonic frequencies relevant to its fundamental, harmonic analysis of the motor would rarely (although sometimes momentarily) include the inverter’s switching frequency and its harmonics. Unlike harmonic analysis, PSA examines all frequencies within its range, acting essentially as a power FFT. This allows for a comprehensive review of active power across motor and inverter harmonics, positioning PSA as the preferred method for analyzing inverter and motor harmonics.
This function is a perfect match for developing inverter control and evaluating magnetic materials used in motors and other devices. devices.
IEC harmonic components,
intermediate harmonic testing
Overview of functions
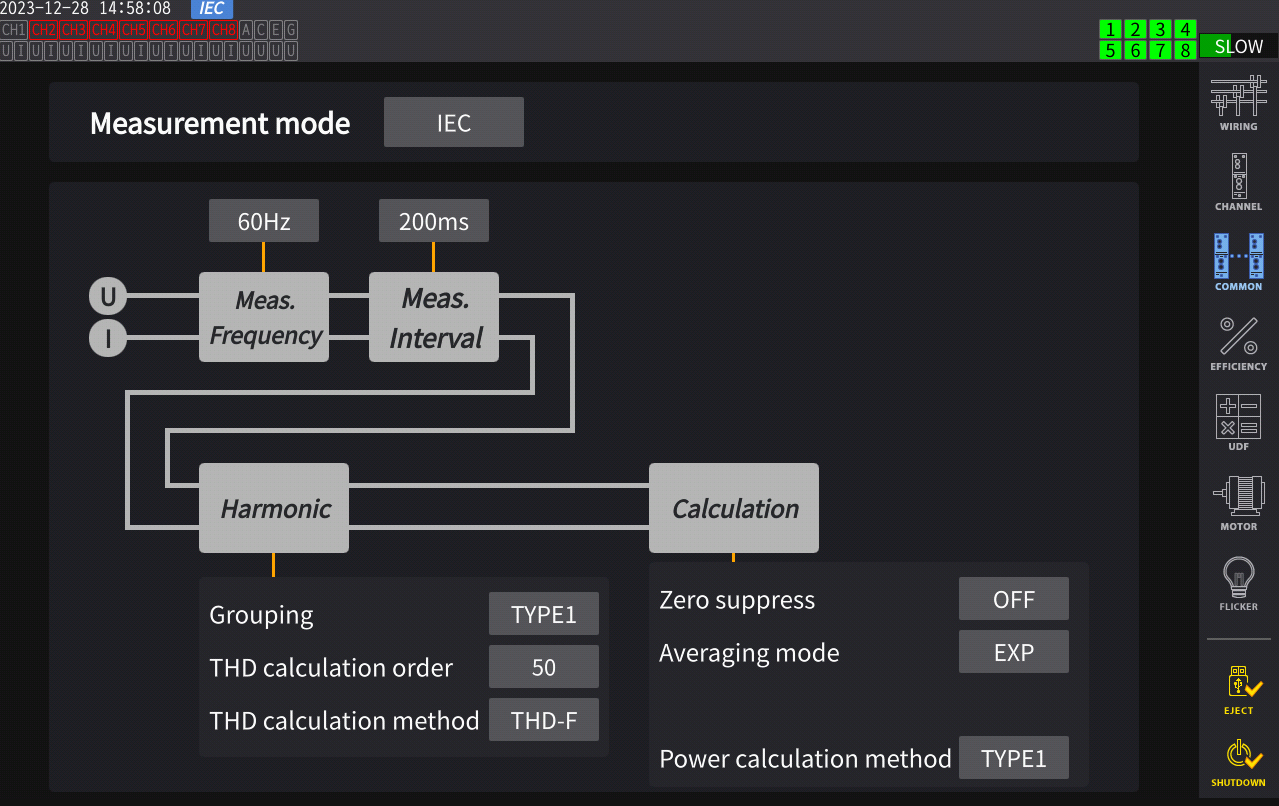
○ Harmonic testing in accordance with IEC 61000 standards
• The PW8001 can comply with measurement standards for IEC harmonic testing.
○ Harmonics testing standards supported by the Power Analyzer PW8001
IEC 61000-3-2: testing of equipment with a rated current of 16 A or less per phase
IEC 610003-12: testing of equipment with a rated current of greater than 16 A and not greater than 75 A per phase
(The specifications of a measuring instrument that can be used for both of the standard-tests above are specified in the standard IEC 61000-4-7:2002. The PW8001 satisfies the specification requirements outlined in this standard for harmonic orders 0 to 200 and inter-harmonic orders 0.5 to 200.5.)
Features
○ Accurate and stable measurement performance
• The Power Analyzer PW8001 and Hioki current sensor combination enables highly accurate and stable measurement of high frequency power. Typically, engineers performing IEC harmonic testing need to add a large margin of error to compensate for high-frequency phase error. However, this pair’s high accuracy and stability eliminates this need even in applications with demanding IEC-limits for harmonic emissions.
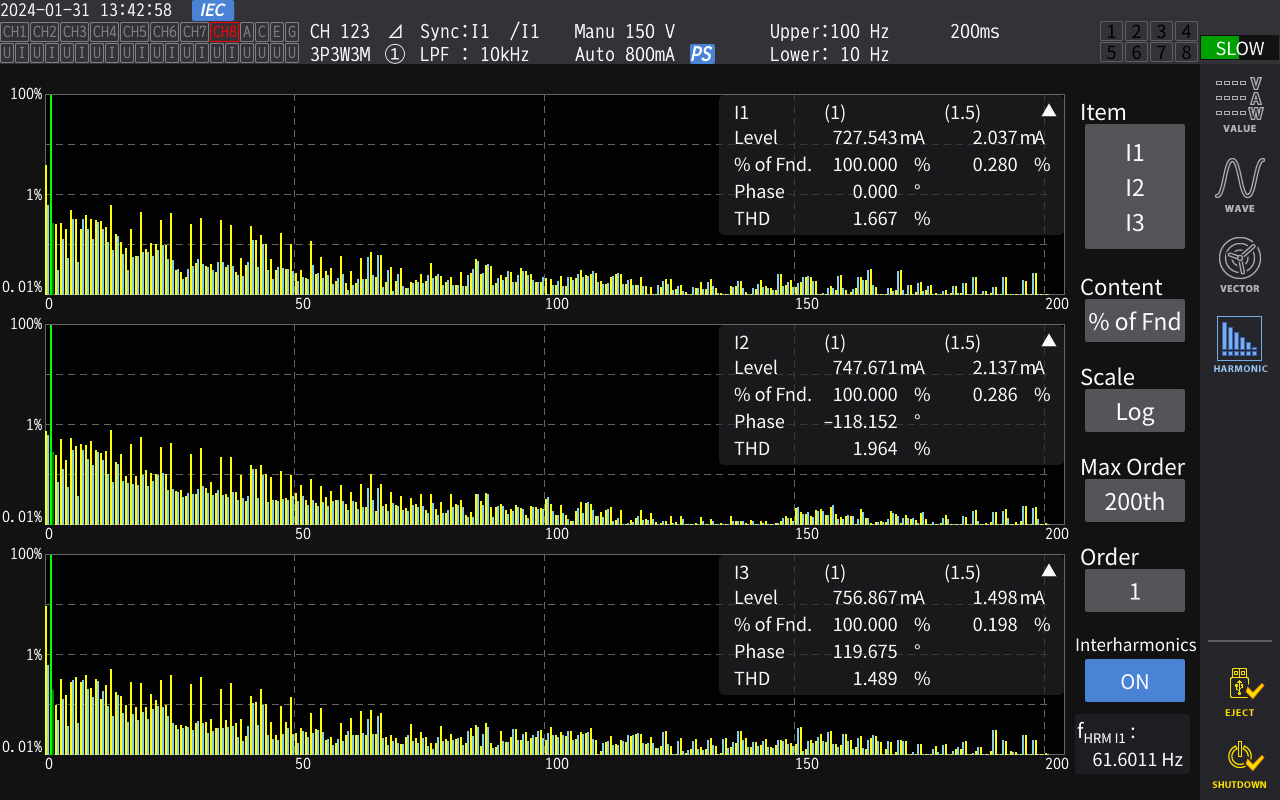
○ Graphical display
• The PW8001 can graphically display harmonics and interharmonics on the same screen. It has a high frequency range, analyzing up to the 200.5th order.
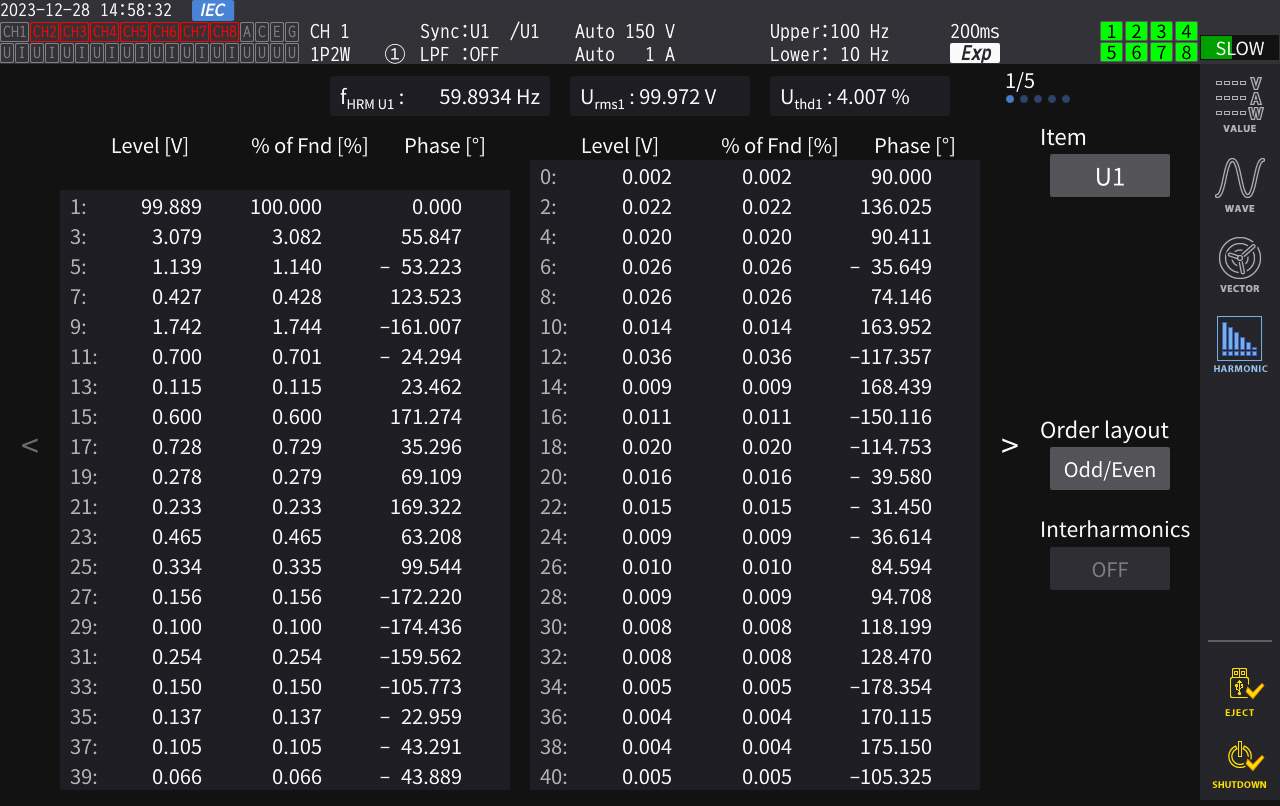
○ Display odd and even orders separately
• The PW8001 can display odd and even orders separately.
→Improves work efficiency
IEC voltage fluctuation, flicker
Overview of functions
○ Voltage-fluctuation/flicker measurements in accordance with IEC 61000 measurement standards
• Perform measurement that complies with IEC voltage-fluctuation and flicker testing standards.
○ The PW8001’s voltage-fluctuation/flicker measurements comply with the following measurement standards
Voltage-fluctuation and flicker testing standards supported by the Power Analyzer PW8001
IEC 61000-3-3: testing of equipment with a rated current of 16 A or less per phase
IEC 61000-3-11: testing of equipment with a rated current of greater than 16 A and not greater than 75 A per phase
(The specifications of a measuring instrument that can be used for both of the standard-tests above are specified in the standard IEC 61000-4-15:2010. The PW8001 satisfies the specification requirements outlined in this standard (accuracy: Pst ±5% [Pst = 0.2 to 5]; dc, dmax: ±4% [when dmax = 4%])
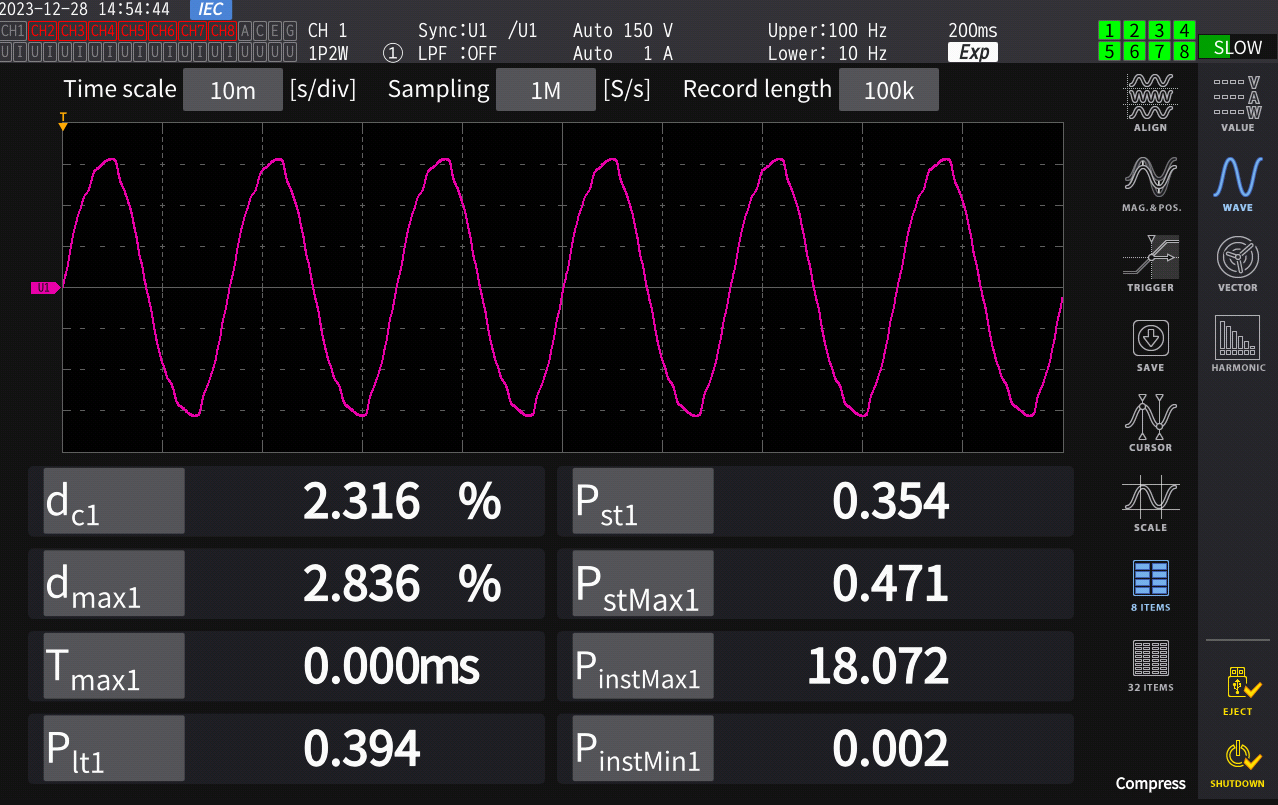
Measurement items
• Short-term flicker rate (Pst)
• Short-term flicker maximum (PstMax)
• Long-term flicker rate (Plt)
• Max. instantaneous flicker (PinstMax)
• Min. instantaneous flicker (PinstMin)
• Relative steady-state voltage change (dc)
• Max. relative-voltage change (dmax)
• Time during which the relative-voltage change exceeds threshold value (Tmax)

Features
○ Use simultaneous measurement capability to perform multifaceted verifications
• The PW8001 can simultaneously calculate power while performing other computations including flicker and harmonic analysis. It does all of these operations simultaneously and in parallel. As a result, all analysis results can be accurately output during a single measurement cycle, allowing multifaceted verification.
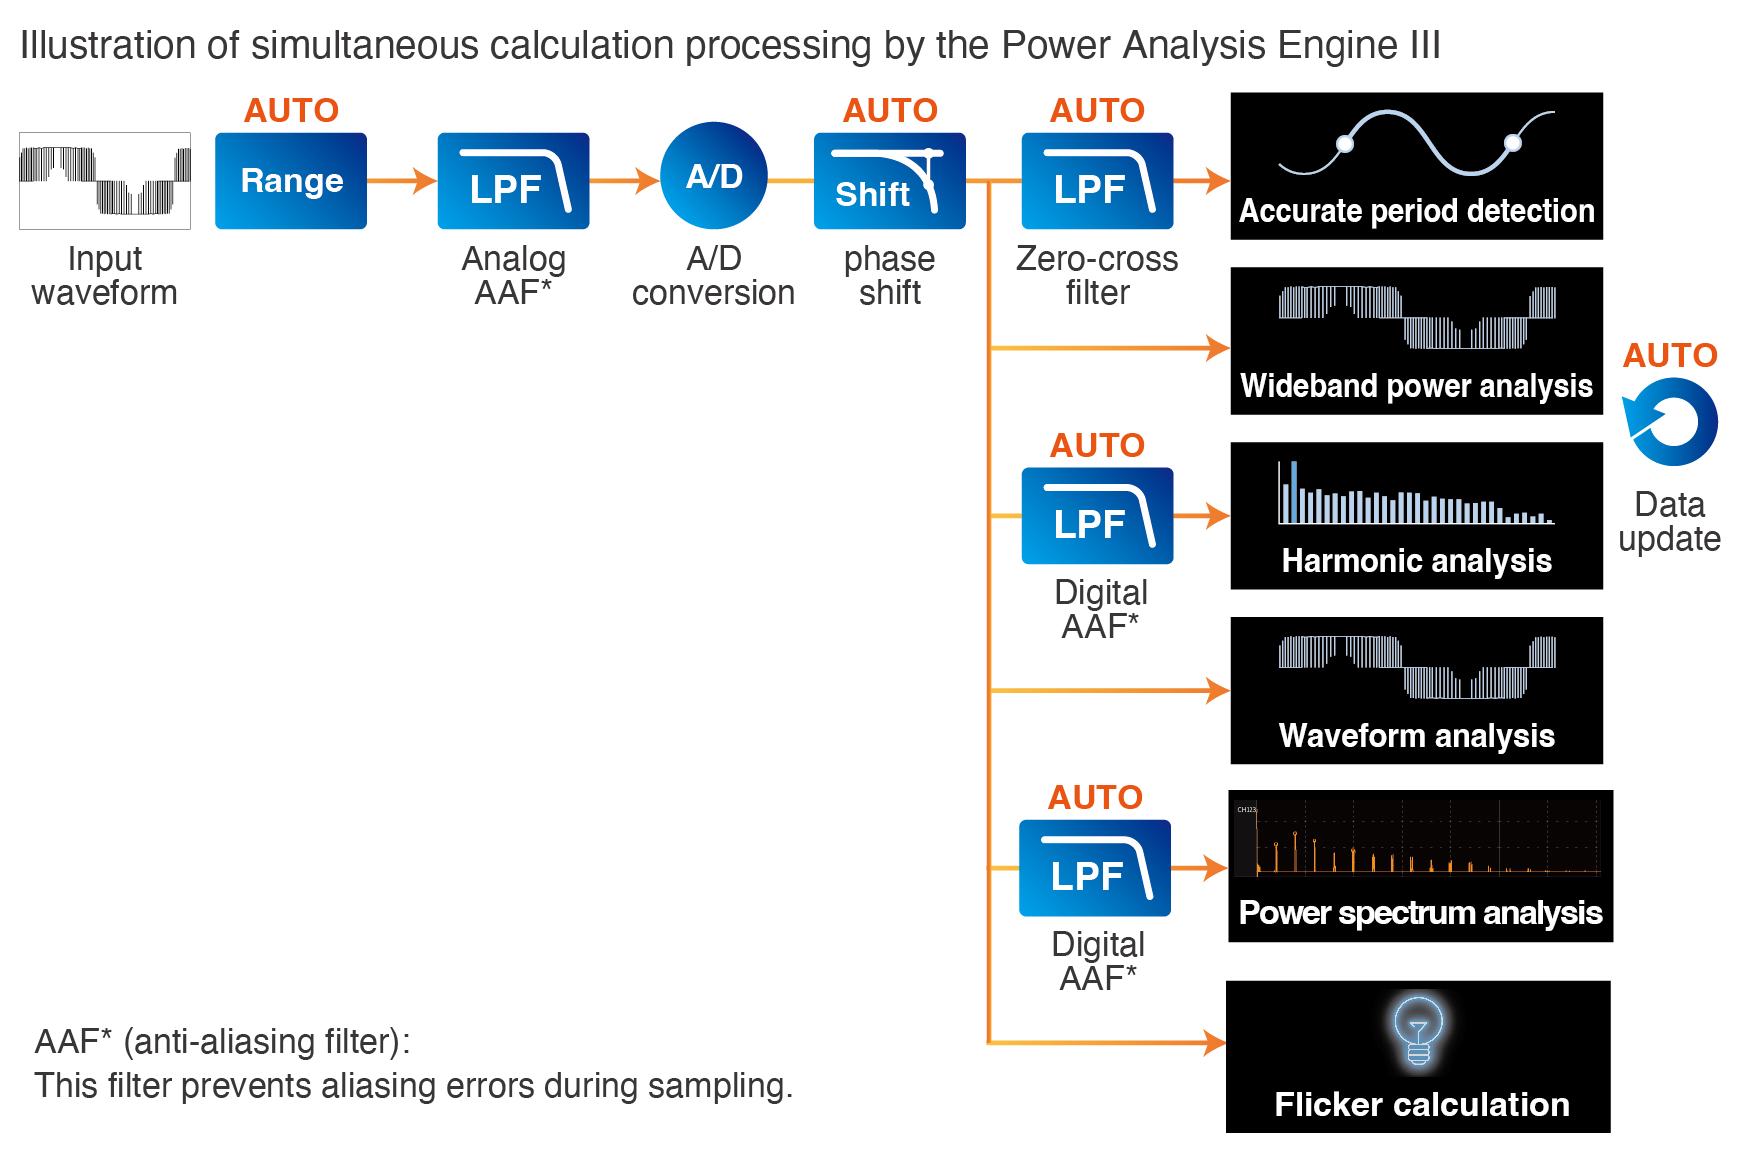
Simultaneous processing architecture of the power analysis engine in the PW8001
Optical link
(Available with factory-installed options PW8001-04, -05, -06, -14, -15, and -16)
Video: Acts like one 16-channel power analyzer
Overview of functions
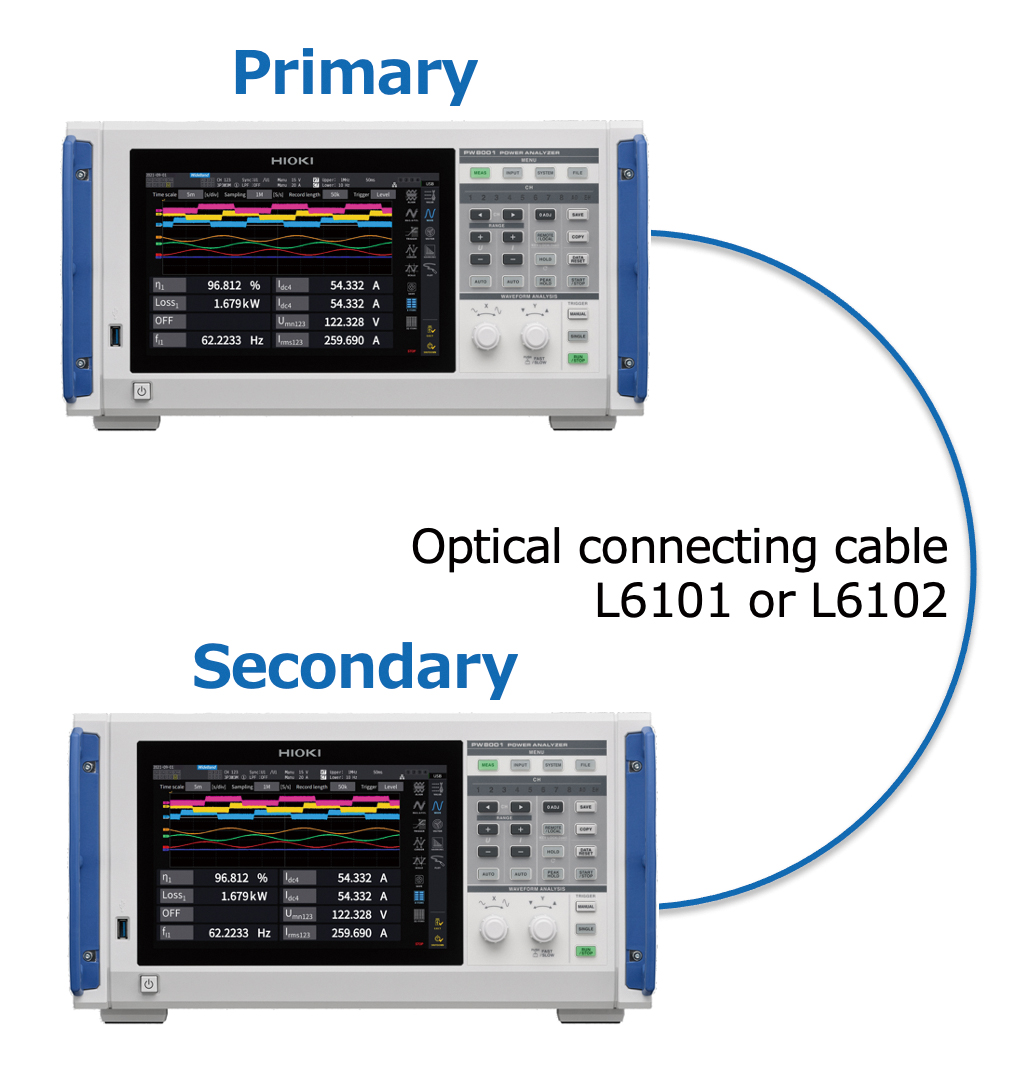
Synchronous power measurement of 16 channels by optical link
○ Synchronization between primary and secondary
• Synchronized data-refreshing
• Display secondary data on primary
• Parameter data from the secondary unit can be set for calculation on the primary unit (e.g., accuracy calculation or user-defined calculation function [UDF])
• Data integrated to the primary unit can be output as D/A or CAN and saved to a USB drive.
• Communication commands can be sent from the primary unit to the secondary unit.
Like using a 16-channel power meter
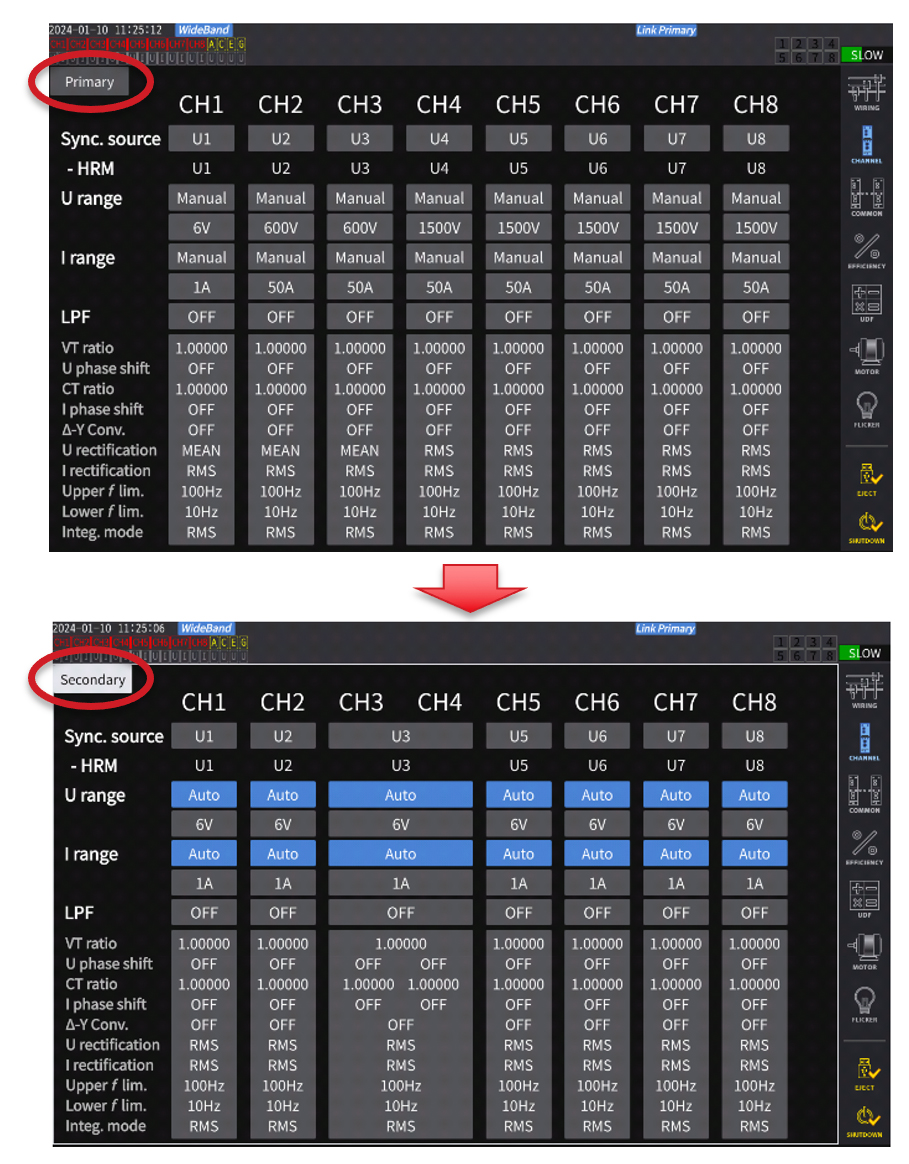
○ Change secondary-instrument settings from the primary instrument
• You can switch between primary and secondary pages on the primary instrument, allowing you to change and review both instruments’ settings.
• This capability lets you efficiently collect data using a simple system architecture, eliminating the need to operate two power analyzers separately.
Use cases
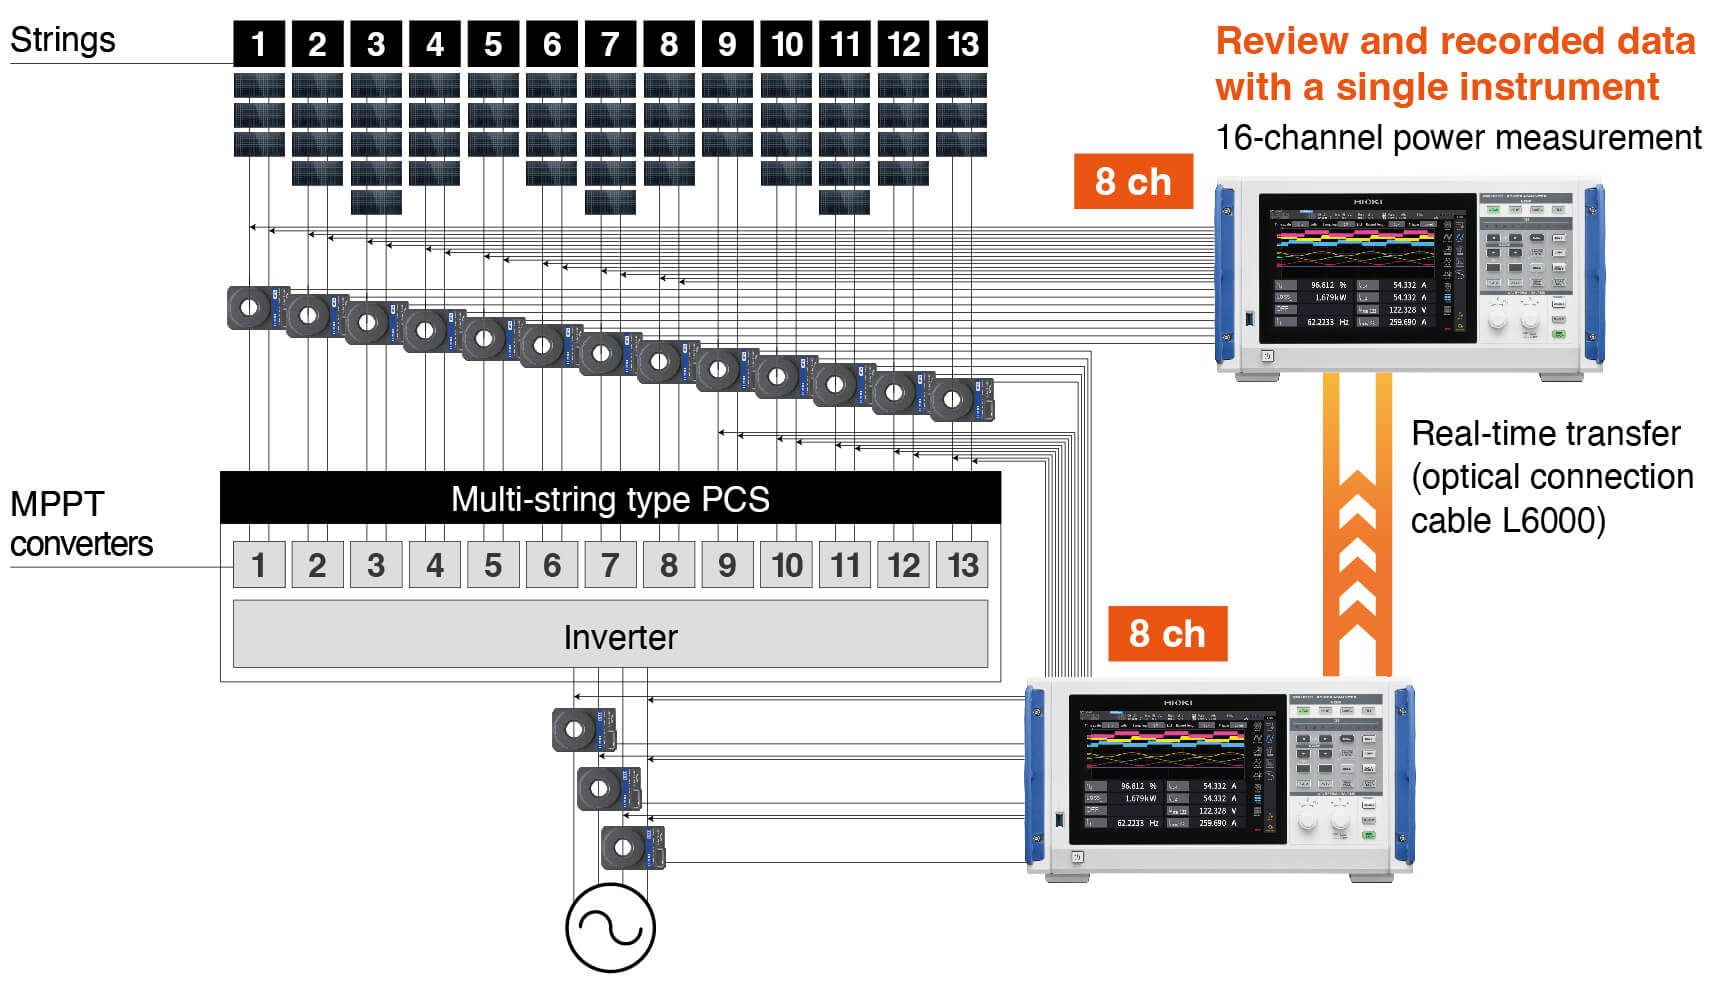
○ Enables efficiency measurement of PV inverters with 13 MPPT (Maximum Power Point Tracking) circuits
• Measure power conversion efficiency by using 13 channels to measure the inverter’s DC inputs and 3 channels to measure 3-phase AC output.
In the past, multiple units were used to measure the basic parameters, and later the data was integrated to calculate power conversion efficiency. The cumbersome and time-consuming task of time-synchronization and integration is now already done by the pair of PW8001s, making analysis smooth and stress-free.
→Simplify complex procedures!
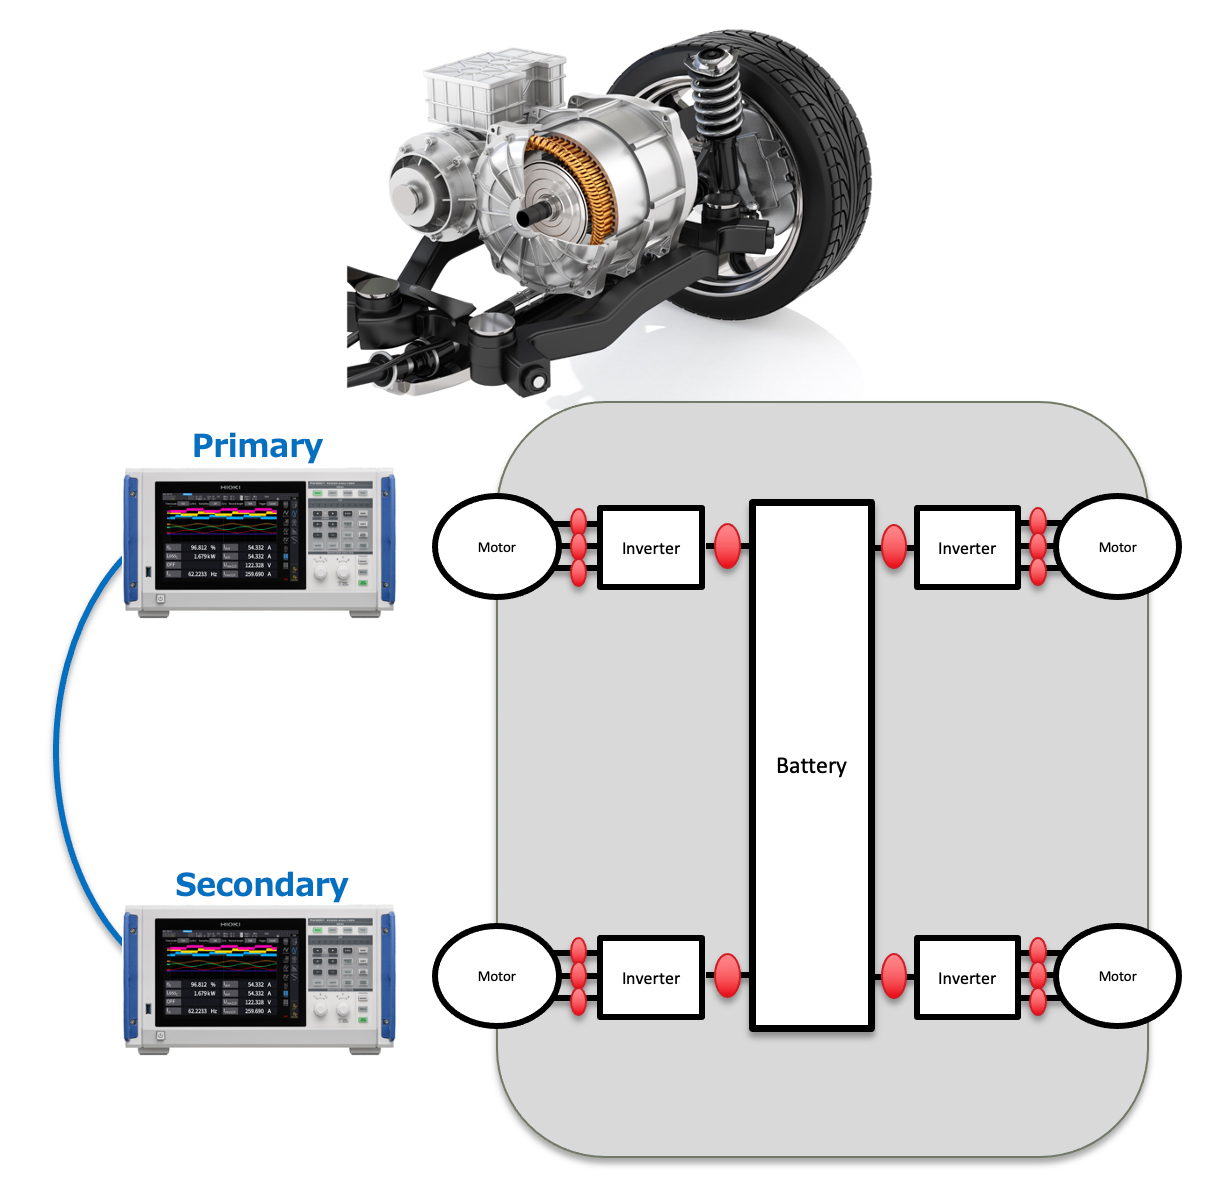
○ Simultaneous measurement of 4-wheel IWM s (in-wheel motors)
• Simultaneously measure 4 motors using 16 channels.
• In-wheel motor (IWM) technology puts an inverter and motor inside each wheel. To assess inter-motor cooperation and variability when evaluating vehicle performance, it’s necessary to measure all motors at the same time.
By using the PW8001’s optical link interface, you can simultaneously measure torque, RPM, and motor power for four motors.
If using all 16 channels, you can simultaneously measure inverter efficiency and motor efficiency at each wheel as well as the vehicle’s overall efficiency.
BNC synchronization
Overview of functions
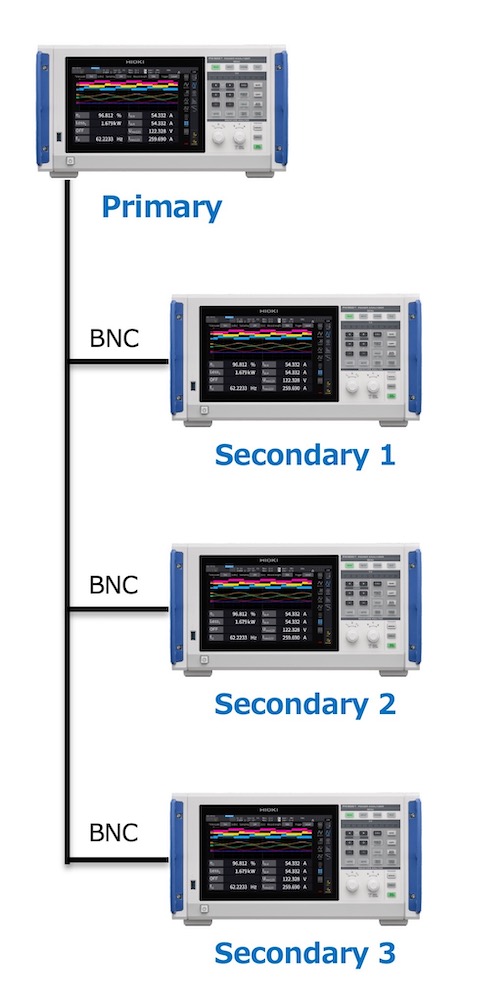
○ Synchronized power measurement across up to 4 instruments (up to 32 channels) using BNC synchronization
• For applications requiring up to 32 channels, time-synchronized measurement of 4 PW8001s can be done with BNC cables. (1 is the primary unit, and the 3 others are secondary.) Settings of each unit can be operated on the primary unit. Although the data is saved in each unit, they are time-synchronized for later analysis. Since the measurement-timing is synchronized, this function makes consolidation and analysis easy.
○ Synchronized items
• Timing of internal operations and data-refresh
• Integration start/stop/reset
• Display hold (HOLD & PEAK HOLD) and data-refresh during hold
• Zero adjustment
• Save, copy
• Current time
Use cases
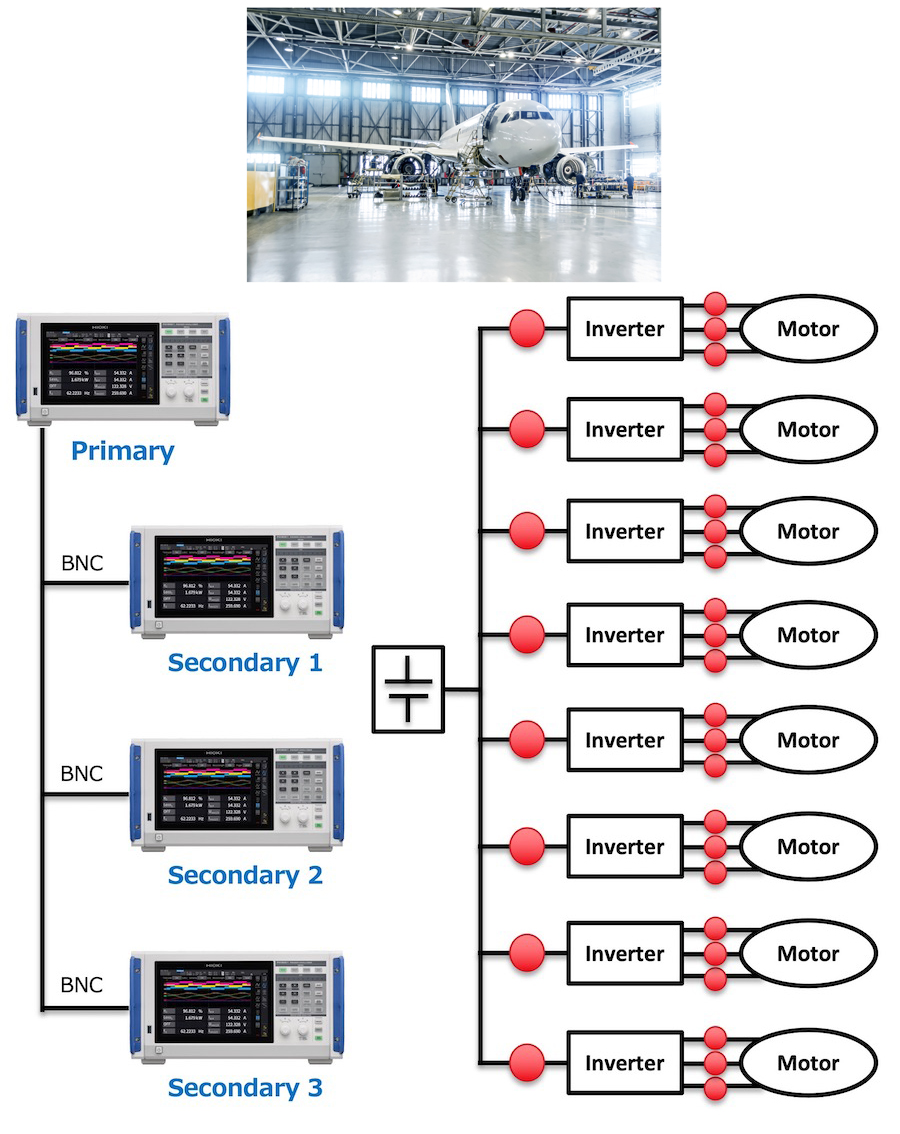
Simultaneous measurement of multiple parallel inverters
Issues
Aircraft, ships, and other applications that demand a large amount of drive power sometimes distribute power using multiple inverters that are connected in parallel. When evaluating such systems as a whole, engineers sometimes wish to evaluate power of multiple inverters at the same time. However, if measurements are made separately using multiple power analyzers, the timings of measurement are not aligned making it difficult to combine the data later.
○ Solution with BNC Synchronization
• When using BNC synchronization, the times at which measurement starts and stops as well as data refresh times and the current time, among other parameters, are precisely aligned, allowing data generated by separate power meters to be saved as part of a single time series.
→This capability eliminates the bothersome task of comparing data times later and makes it easy to integrate data from multiple instruments.
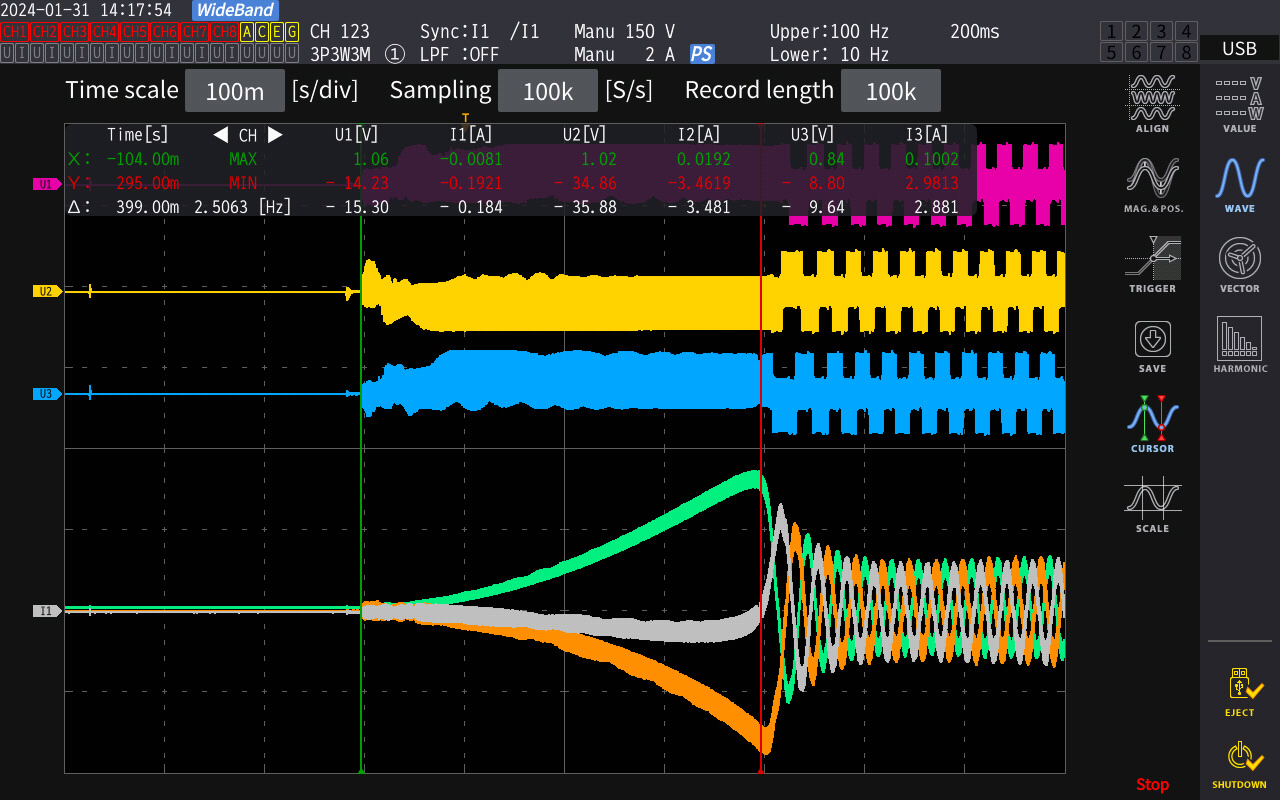
Event trigger
○ Apply triggers using user-defined measurement parameters to capture the desired waveform
• You can capture waveforms before and after the moment you wish to observe by applying triggers to fluctuating numerical data such as RMS values, frequencies, and torque values.
• Triggers can be set using complex conditions based on OR and AND operations.

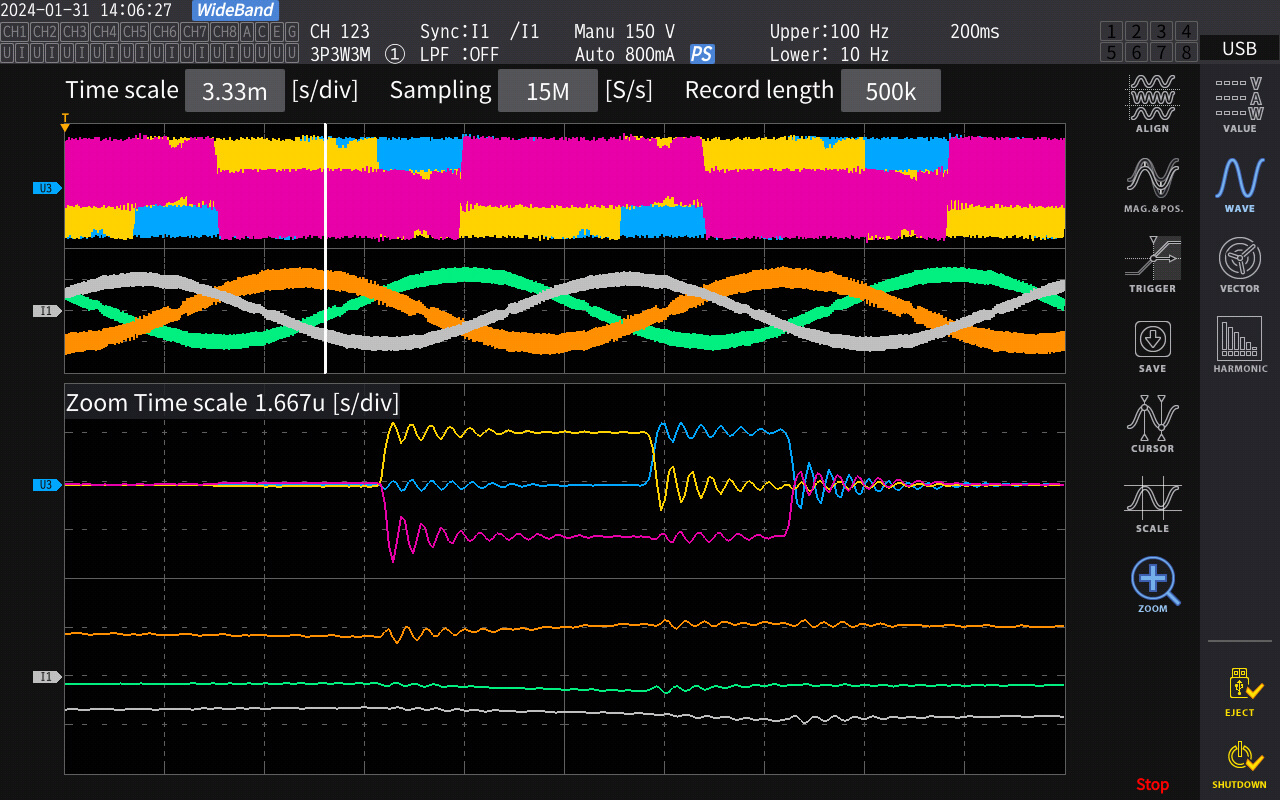
Cursor, zooming
Extensive functionality for analyzing captured waveform data
○ Cursor
• Using the cursor function, you can display measured values for selected waveforms and FFT results.
• Using the XY cursor function, you can display MAX, MIN, ΔU, I, and t values.
○ Zoom
• You can zoom in on captured waveforms along the time axis (with a zoom factor ranging from 2 to 1,000,000).
• Using the rotary knobs, you can intuitively specify the zoom factor and the position of the zoom region.
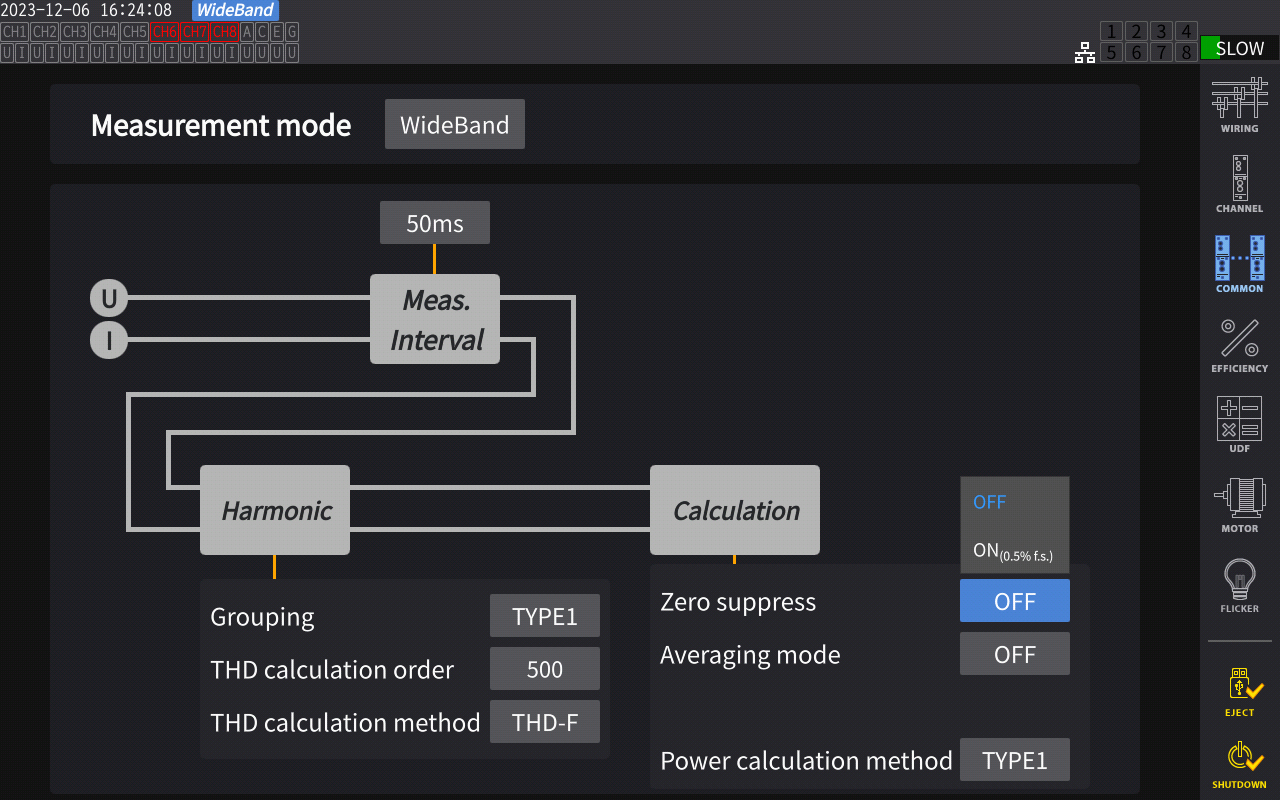
Zero suppression
○ 0 is displayed when there is no input
• Even when there is no signal input, factors such as noise cause the power analyzer to display minute values. When the Zero Suppress function is turned on, these minute values are changed or suppressed to zero.
• Values suppressed to zero: 0-0.5% f.s. of measurement rangero-input is performed.